

Click here to view as PDF. “A bull market is like sex. It feels the best just before it ends.” -The great, late BARTON BIGGS “Wall Street is a place where highly confident got to work. Unfortunately overconfidence makes it hard for many to hold on to the possibility they might be wrong, with potentially painful consequences.” -The great and not late PAUL SINGER, CEO of Elliott Funds, among the best performing hedge funds of all-time. “The further a society drifts from the truth, the more it will hate those who speak it.” -GEORGE ORWELL
INTRODUCTION
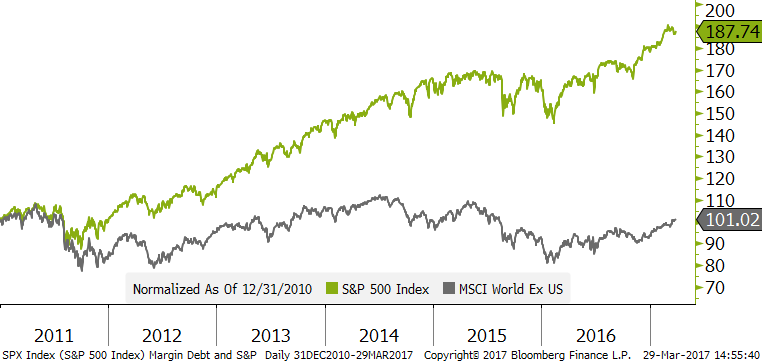
By David Hay / CIO, Evergreen Gavekal The sampler. This week’s edition of the Evergreen Virtual Advisor is a trilogy of recent short articles by three of my favorite thinkers at our partner firm Gavekal. The first is a timely essay by Tan Kai Xian (fortunately he is kind enough to let us refer to him as KX!). As you will soon read, he reflects on last week’s embarrassing flame-out of Obamacare reform and discusses the potential implications for tax reform. “Ryancare,” as some wags call it, was pulled before it went down to almost certain defeat—a casualty of the GOP’s infighting on what was one of its signature campaign promises. Who could have possiblyS&P 500 HAS NEARLY DOUBLED THE RETURN OF GLOBAL MARKETS EX-US SINCE 2011…
 …BUT IT’S A DIFFERENT STORY THIS YEAR
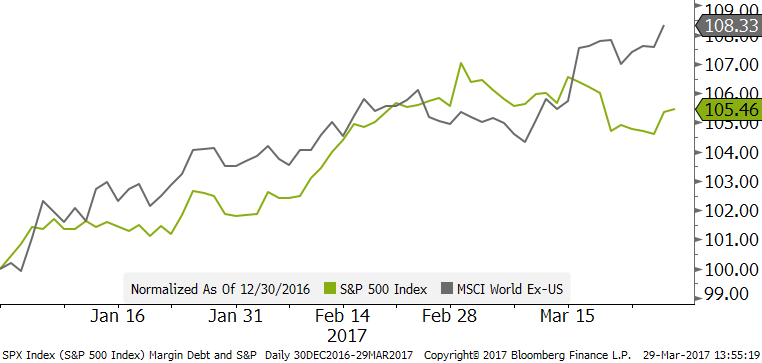 Source: Bloomberg, Evergreen Gavekal
 Source: Gavekal Data/Macrobond
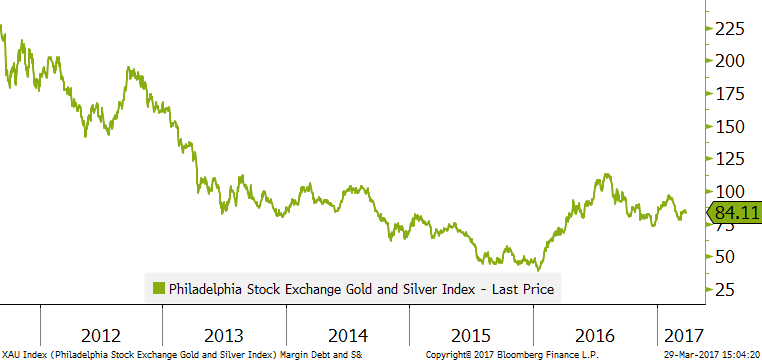
PHILADELPHIA STOCK EXCHANGE GOLD AND SILVER INDEX (2011-PRESENT)
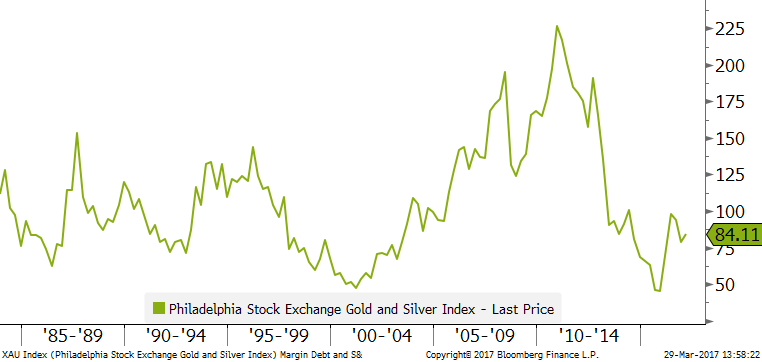
 PHILADELPHIA STOCK EXCHANGE GOLD AND SILVER INDEX (1979-PRESENT)
 Source: Bloomberg, Evergreen Gavekal
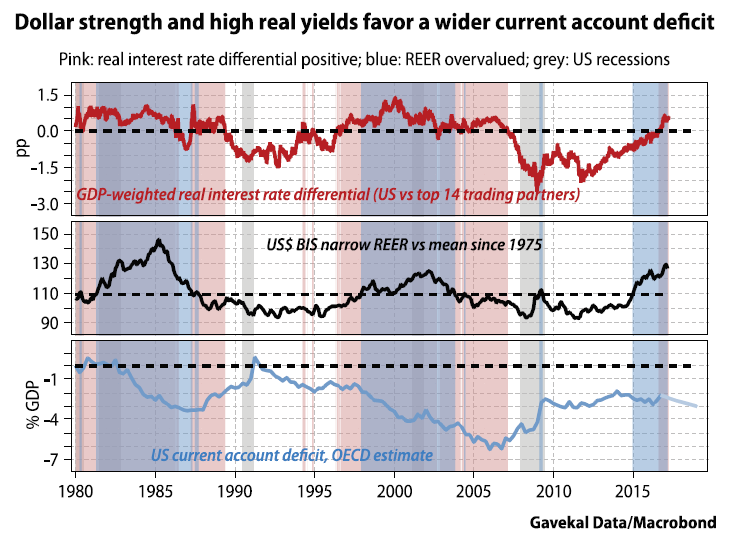
AFTER THE HEALTH CARE REFORM FAILURE By Tan Kai Xian The Republican drive to repeal and replace Obamacare failed ignominiously last Friday. Together, President Donald Trump and House Speaker Paul Ryan were unable to muster enough support to pass the new health care bill through the House of Representatives. Bowing to reality, they pulled the vote. If there is a positive element to this failure, it is that both the administration and Congress will now shift their focus to tax reform. However, the setback on health care—the new administration’s first big legislative test—has badly damaged the confidence of US households and businesses in Trump’s ability to push his reform agenda through Congress. Investors’ already dwindling belief in the sustainability of the Trump trade is only likely to diminish further as a result. The obstacles to tax reform are at least as great as those that blocked the health care bill. For one thing, without the projected fiscal savings from replacing Obamacare, the backers of tax reform will have an even bigger fiscal hole to fill when they table their bill. For another, the White House view of the border adjustment taxes proposed by the House Republicans remains unclear. With US retailers lobbying aggressively against the idea and a sizable number of Republican Senators publicly expressing concerns about the potential impact, the headwinds are stiff. As a result, it is now abundantly clear that fiscal and regulatory reforms are going to take a lot longer to accomplish than many investors previously hoped. That means the post-election optimism on US growth prospects is likely to moderate further. Granted, the hard data, such as industrial production, have shown a modest improvement lately. But, the rebound has been less strong than indicated by soft data, such as sentiment indexes. If the soft data now eases, hopes for a strong cyclical upturn in growth will dissipate. That will further dampen enthusiasm for the Trumpflation trade, which has waned lately as expectations for higher nominal growth have eased. The diminishing base effect from last year’s rebound in oil prices and slowing bank credit growth both point to moderating US inflation. In response, the US break-even inflation rate has started to fall, the yield curve is flattening, the outperformance of bank shares is reversing, and the US dollar has weakened from December’s highs. Last Friday’s blow to the administration’s reform agenda only increases the odds of a further reversal in the Trump trade. That’s clearly a headwind for US risk assets. However, it also means that both structural and cyclical forces in the US now increasingly favor the outperformance of emerging market assets. With the near-term prospect of stimulative US reforms much reduced, the chances of a steeper monetary tightening path from the Federal Reserve are also diminished. As a result, the risks of a higher long bond yield and a stronger US dollar—both major concerns for emerging market investors—have receded. On top of that, the US current account deficit is widening. The US trade deficit came in at US$48.5bn in January, the biggest gap since March 2012. With US consumers buying more overseas goods and services, this is a clear sign that additional US dollar liquidity is flowing abroad. For two reasons, this is likely to mark the beginning of a new downward trend in the US current account:
- The US dollar is overvalued. In relative terms, that makes non-US goods and services cheaper and US products expensive, leading global consumers to favor non-US goods and services.
- Real yields are now higher in the US than in America’s major trading partners. This makes sense; the US economy is now approaching full capacity, while other major economies, notably in Europe, are still in the early stages of recovery. In the past this dynamic has been highly supportive of capital flows into the US, encouraging a widening of the current account deficit.
 Source: Gavekal Data/Macrobond
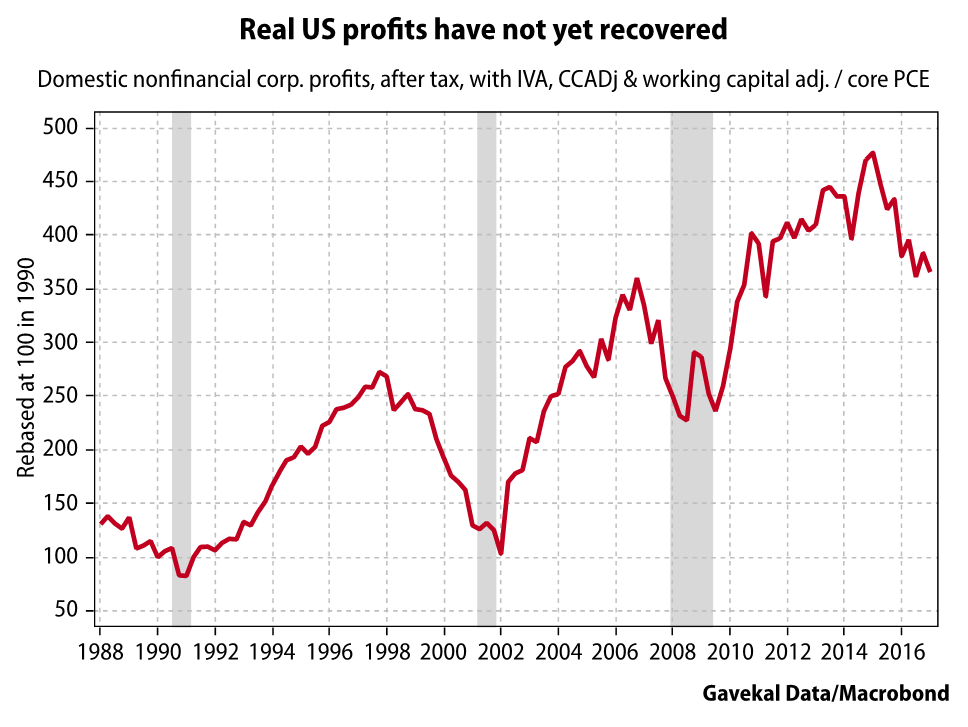
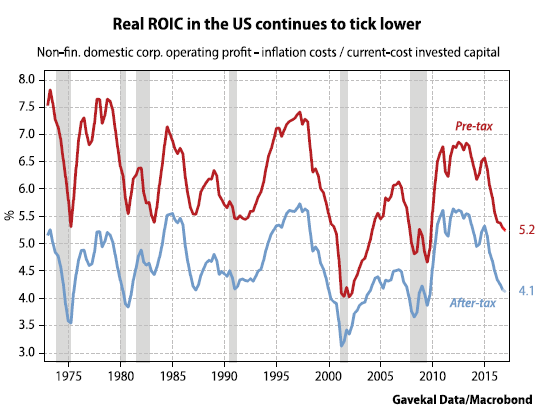
THE PROFIT ILLUSION By Will Denyer Inflation has a way of making things look better than they really are. This is especially true of corporate profits. After a dismal first half last year, S&P 500 companies reported an earnings recovery in 2H16. In the final quarter, they posted profit growth of 6% YoY (with or without financials). Alas, this recovery appears to be a mirage, caused by accelerating inflation. Using official flow of funds data for the domestic non-financial corporate sector, and adjusting for the effects of inflation, I find that US corporate returns, in real terms, were flat in the second half of 2016 and actually ticked down in 4Q. There has been no recovery in profits. One might think that 6% nominal profit growth, in the context of 1.5-2% inflation, would give positive profit growth in real terms. It does not. It is not enough simply to deflate headline profits by an inflation index. The trouble is that conventional accounting does not adjust for the rising cost of replacing capital, such as depreciating assets and inventories. Inflation pushes up revenues, while depreciation and the cost of goods sold are deducted based on historical costs. This makes profits look greater than they really are. This problem was articulated over 100 years ago by Ludwig von Mises, in his classic book, The Theory of Money & Credit:
“If the value of money falls, ordinary book-keeping, which does not take account of monetary depreciation, shows apparent profits, because it balances against the sums of money received for sales a cost of production calculated in money of a higher value, and because it writes off from book values originally estimated in money of a higher value items of money of a smaller value. What is thus improperly regarded as profit, instead of as part of capital, is consumed by the entrepreneur or passed on either to the consumer in the form of price reductions that would not otherwise have been made or to the laborer in the form of higher wages, and the government proceeds to tax it as income or profits. In any case, consumption of capital results from the fact that monetary depreciation falsifies capital accounting.”Thankfully, the US flow of funds statisticians provide their own measures of corporate profits, adjusted for changes in the replacement costs of fixed capital and inventories (named “capital consumption adjustments” or CCadj, and “inventory valuation adjustments” or IVA). We then extend this logic one step further, applying what we call a “working capital adjustment”—which accounts for the fact that, like inventories and fixed assets, working capital requirements also rise and fall with inflation. Thus, during periods of inflation, a portion of inflows need to be added to working capital rather than treated as profit and consumed. After making these adjustments, whatever profit is left over can then be deflated by a price index. The resulting measure of real profits fell dramatically in 2015 and was basically flat over the course of 2016. If anything, profits have kept falling marginally, with 4Q16 profits actually down a touch versus 3Q and versus a year prior. There has been no recovery. The result is that return on invested capital in the US continues to slide. And with interest rates across the curve having risen in recent months, my various Wicksellian spreads between the return on capital and the cost of capital have narrowed further. Although the Fed softened its hawkish tone, it still hiked rates, and it plans to hike further this year. Investor hopes are high that these increases will be more than offset by a rebound in returns—thanks to rising animal spirits and possible policy reforms. Perhaps. But for now those are just hopes. The facts on the ground still call for caution. With the latest data, my Wicksellian spreads* are not yet flashing red. But they are now glowing a very dark orange, as the most topical spread, based on the Fed Fund rate, suggests. According to my model, equity risk exposure should now be reduced to roughly one quarter of full risk-on levels. Instead, investors should overweight cash and treasuries (possibly throwing gold and gold miners into the mix, as argued by Louis below). * “Any Wicksellian analysis starts with the difference between the market interest rate and the natural interest rate. The market rate…is the real rate on long-dated seasoned industrial bonds, which is [arrived at] by deflating the nominal yield on Baa-rated bonds by the seven-year moving average of US CPI inflation. And as a reliable proxy for the natural rate…simply take the real year-on-year growth rate of US gross domestic product. The difference between the two is the Wicksellian spread.” (For a full tutorial on the Wicksellian spread, please click here.)
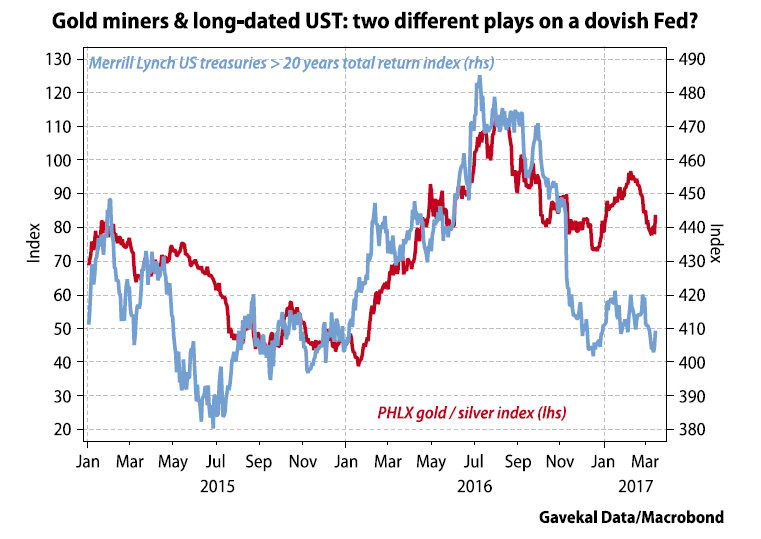
HEDGES IN A BULL MARKET By Louis-Vincent Gave It is hard to find an equity market anywhere that is not in bull market territory. This much is clear from a quick look at the Gavekal TrackMacro grid. Simply put, not a single country is now flashing red. You have to go back to the Spring of 2014 for such a benign global macro backdrop. This isn’t to say that equity markets face no risks. The March 15th election results in the Netherlands may suggest that the populist wave in Europe is waning, but political risk remains high. In the US, policymaking is increasingly haphazard. In China, while stability will undoubtedly be maintained in the lead-up to the Party Congress this fall, it remains unclear what type of leader Xi Jinping aims to be, and for how long? This last point especially matters given Pyongyang’s bellicosity. And that’s before the potential for a chaotic French parliamentary election is considered, as the historic parties of government (Les Republicains and the Socialist Party) both seem to be imploding. Or the fact that the mess in Italian banks is unlikely to be dealt with by a government with little popular backing. Yet bull markets famously climb a “wall of worry”. The fact that equities are trending higher despite so many worries can be explained variously: (i) the fact that, in recent years, central banks have created so much liquidity, (ii) the growing realization that under a mercantilist US president a US dollar short-squeeze may not unfold, or (iii) recognition that instead of imploding, Chinese growth is busy reaccelerating. It almost doesn’t matter for, as popular wisdom states, success has many fathers. Still, as global equity markets continue to make new highs, the prudent investor is left wondering how to hedge? For years, the simple answer has been to buy long-dated bonds. As equities tank, bonds always thrive; looking back at every -15% or more annual drop in the S&P 500 since 1962 shows a corresponding 10% or more rise in bond prices. This characteristic of bonds is the bedrock of most “risk-parity funds” and the reason why disciplined balanced funds have, over long periods, delivered solid risk-adjusted returns. At least, until the past year when the prevalence of very low bond yields almost everywhere caused bonds to hit many portfolios with more volatility and negative returns. This begs the question of whether bonds remain the most efficient portfolio diversifier. As such, consider the chart below which in recent years shows a surprisingly strong correlation between gold miners and long-dated bonds. Historically, these two assets have tended to move in opposite directions, with accelerating inflation being good for gold, and bad for bonds, and vice versa. Now, they seem to be moving together, based on market perception of what the Federal Reserve will do next.
 Source: Gavekal Data/Macrobond
OUR CURRENT LIKES AND DISLIKES
No changes this week.
LIKE
- Large-cap growth (during a correction)
- International developed markets (during a correction)
- Canadian REITs
- Cash
- Publicly-traded pipeline partnerships (MLPs) yielding 7%-12%
- Intermediate-term investment-grade corporate bonds, yielding approximately 4%
- Gold-mining stocks
- Gold
- Intermediate municipal bonds with strong credit ratings
- Select blue chip oil stocks (on a pull back)
- Emerging bond markets (dollar-based or hedged); local currency in a few select cases
- Investment-grade floating rate corporate bonds
- Mexican stocks
- Solar Yield Cos on a pull-back (and profit-taking for tax deferred accounts, in some cases)
- Long-term municipal bonds
- Long-term Treasury bonds
- Long-term investment grade corporate bonds
NEUTRAL
- Most cyclical resource-based stocks
- Short-term investment grade corporate bonds
- High-quality preferred stocks yielding 6%
- Short yen ETF (closing out positions and removing)
- Emerging market bonds (local currency)
- Short euro ETF (sell a portion for solid gain)
- Bonds denominated in renminbi trading in Hong Kong (dim sum bonds)
- Canadian dollar-denominated bonds
- Mid-cap growth
- Emerging stock markets, however a number of Asian developing markets, ex-India, appear undervalued (taking profits on India)
- Floating-rate bank debt (junk)
- Select European banks
- BB-rated corporate bonds (i.e., high-quality, high yield)
DISLIKE
- US-based Real Estate Investment Trusts (REITs) (once again, some small-and mid-cap issues appear attractive)
- Small-cap value
- Mid-cap value
- Small-cap growth
- Lower-rated junk bonds
- Large-cap value
DISCLOSURE: This material has been prepared or is distributed solely for informational purposes only and is not a solicitation or an offer to buy any security or instrument or to participate in any trading strategy. Any opinions, recommendations, and assumptions included in this presentation are based upon current market conditions, reflect our judgment as of the date of this presentation, and are subject to change. Past performance is no guarantee of future results. All investments involve risk including the loss of principal. All material presented is compiled from sources believed to be reliable, but accuracy cannot be guaranteed and Evergreen makes no representation as to its accuracy or completeness.