


Click here to view as PDF. “All investment frenzies pass. The market is gloriously inefficient and wanders far from fair price but, eventually, after breaking your heart and your patience…it will go back to fair value. Your task is to survive until that happens.” -JEREMY GRANTHAM, co-founder of GMO, one of America’s largest investment advisors.
SUMMARY
- Jeremy Siegel contends that stocks win over a 20-30-year period so it doesn’t matter how expensive the market is when you first invest.
- However, one glaring example undermines his point: the Japanese market from 1990 – present, which has returned -30%.
- Not helping Siegel’s argument is that the S&P 500 has returned a measly 4.7% per annum since the tech bubble popped in early 2000. Net of taxes and inflation, that’s only about 2% per year. But a bigger problem is yet to come…
- If (actually when) we enter a bear market, returns over a 20-year period would be even lower. Under this scenario, is it possible that the currently wildly popular notion of buy-and-hold-forever could lose credibility?
- While we admit that the market trend is up, a “double-tightening” caused by the Fed raising rates and cutting its balance sheet seems likely. This puts added pressure on the optimism that markets can only go higher.
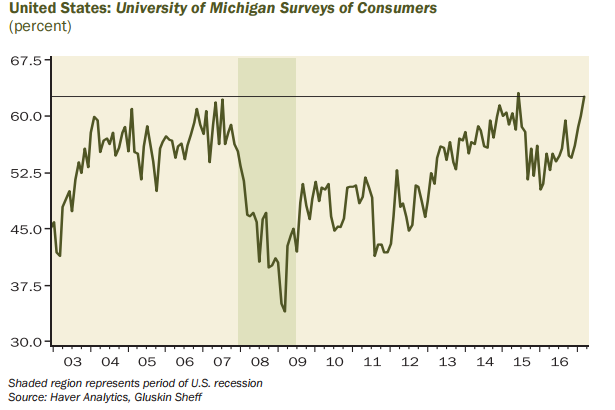
- A recent survey found that US consumers are as bullish about the stock market as they were in 2007 and 2015. A huge decline ensued in 2008 while there were two 12-15% corrections after the 2015 optimism peak.
- Extreme positioning is a tell-tale signal for the contrarian investor to invest the other way.
- Buying into deep pessimism and selling into frenzied optimism is the antithesis of buy-and-hold. But, it’s working and we believe it will continue to do so.
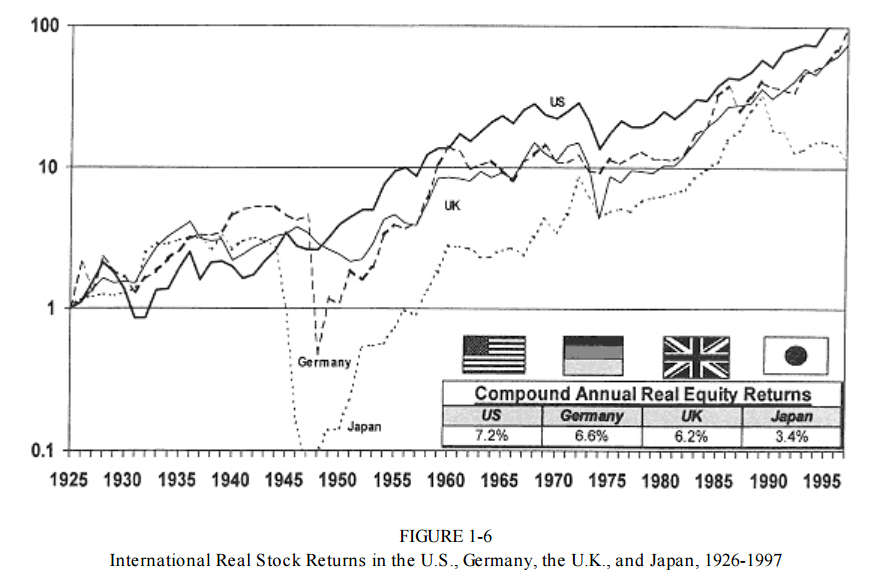
Note: For a quick recap of some important questions facing investors in the stock market today, please see the final section of this week’s EVA titled “The two-minute drill.” Buy-and-hold, the path to gold? Nearly 25 years ago, Jeremy Siegel’s book, “Stocks for the Long Run”, hit the market. It was an instant bestseller, at least by financial book standards. His timing was propitious, since it came out in the middle of the biggest bull market in history. His basic premise—that stocks are sure winners over time—has certainly been borne out by the returns on the S&P 500 since his book was first published. To wit, the S&P has produced a total return of 9.7% annually from the 1994 publication date of “Stocks for the Long Run” through March 31st of this year. Case closed, right? Maybe not. One of Professor Siegel’s critical points is that if you hold stocks long enough—like 20 years—it doesn’t matter how expensive the market was when you first invested. Even wars and total economic collapse, such as Japan and Germany endured, did not prevent positive returns from being achieved, at least looking back from the vantage of 1994.
Source: Jeremy J. Siegel, the Wharton School of the University of Pennsylvania
Yet, ironically, the performance of the Japanese market itself since then is a glaring exception. As most EVA readers are aware, Japan experienced dual bubbles in stocks and real estate in the 1980s, until they catastrophically burst in 1990. Now, some 27 years later, the total return on the Japanese index has been roughly minus 30%. So much for the infallibility of a long enough holding period! However, I guess, even nearly 30 years isn’t up to Warren Buffett’s preferred ownership timeframe—as in, forever. Yet, for us Baby Boomers, who are increasingly the most numerous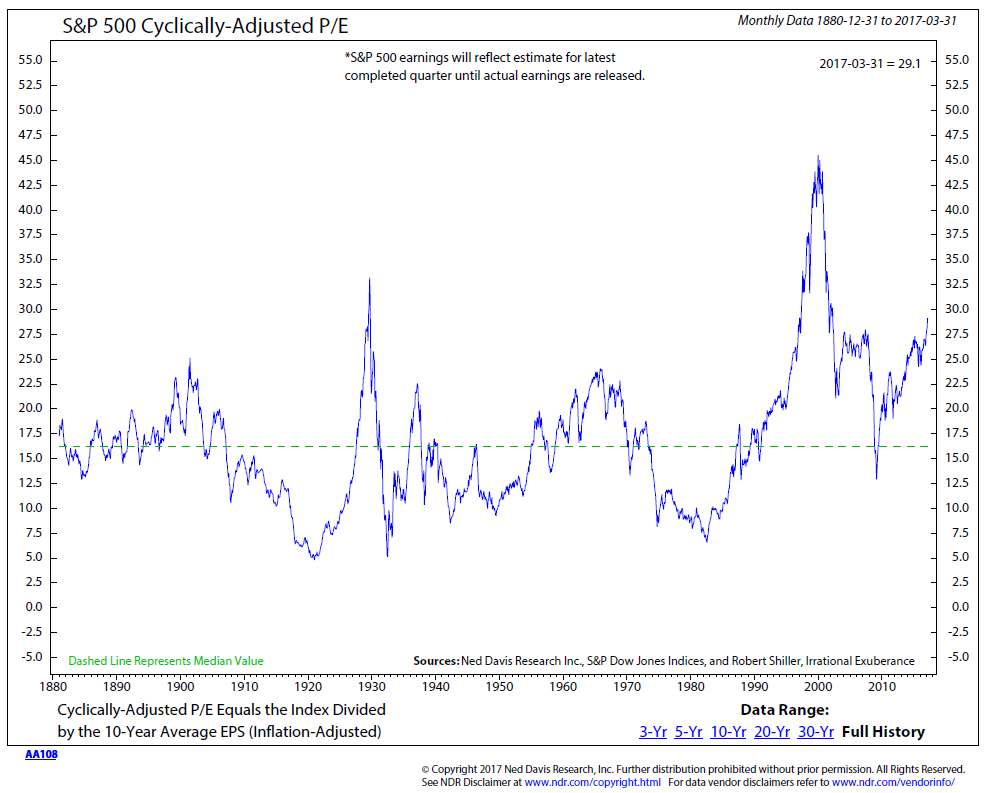 Source: Ned Davis Research
As you can see above, by the end of 1999—almost 70 years after the ’29 crash—the US stock market was actually more expensive on a valuation basis than it was when buying stocks with just 10% down (i.e., 90% on margin) was commonplace. Optimists can point out that the market “only” de-rated by 49% during the 2000 to 2002 bear market but that understates the carnage. This is because during the late ‘90s most investors were intoxicated with the tech-heavy NASDAQ and the “NAZ” vaporized by nearly 80% over those grueling two and a half years. The difference compared to the 90% nuking stocks took from 1929 to 1932 was negligible. (By the way, even investors in a plain-vanilla S&P 500 index fund in those days were heavily tech-exposed; this is because nearly 50% of the S&P was in technology and telecom issues at the time.)
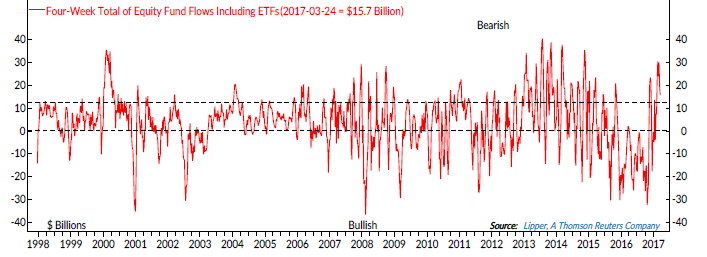
Now, 17 years after the peak of the late 1990s-stock bubble, the market would seem to have pretty much vindicated Professor Siegel’s views that time heals all stock wounds. The “pretty much” comment relates to the reality that stocks have returned a tough-to-live-on 4.7% since 12/31/99. Net of taxes and inflation, you’re talking maybe 2% a year. But the bigger problem is yet to come… When euphoria collides with a double-tightening. Anyone who doesn’t think a bear market is inevitable is clearly delusional. To (almost) quote the great financial guru, Forrest Gump, “Stuff Happens!” Let’s assume we dodge a serious shakeout for another year, stocks rise a further 10% from here, and then there is a garden-variety 30% bear market over the next 12 months. That would put the market around 1800—interestingly, around where it troughed in February of last year. At that point, the per-year return on the S&P 500 from 12/31/99 over a period of nearly 20 years would be a measly 3.1% per annum. Should the decline be deeper, as is highly likely after so many years of artificially muted downside volatility (caused by central banks), the numbers will, of course, be even more dismal. Let’s make the same assumptions as in the forgoing paragraph but use a 50% vs a 30% decline. That would mean about 1300 on the S&P sometime in 2019—again, assuming a 10% additional increase prior to the plunge—below where it closed in 1999. If it falls this far (remember that the S&P plunged 49% from peak to trough in 2000 – 2002 and 57% from the 2007 apex to the early 2009 bottom), then the total return—i.e., including dividends—for almost twenty years from the main US stock index would be a paltry 1.4%. And that’s before subtracting inflation and taxes which would push the effective return into the red. Under either one of these scenarios, it’s highly probable that the currently wildly popular and closely related notions of buy-and-hold-forever, as well as the supposed superiority of passive (i.e., index) investing, will begin losing adherents at the speed of a Tomahawk cruise missile. The behavior of the majority of investors over the last 17 years reveals scant willingness to buy into severe market declines. In fact, the polar opposite has been on display in each of the two aforementioned bear cycles. Massive outflows from equity funds occurred during both 2000–2002 and 2007–2009, despite the “50% off” sale that should have, rationally, attracted legions of bargain-hunters. (In fact, investors ran for the exits en masse even during the two mild pull-backs in the summer of 2015 and early 2016.)INFLOWS (ABOVE THE LINE) + OUTFLOWS (BELOW THE LINE) FROM ALL EQUITY (STOCK) FUNDS FROM 1998-2017
 Source: Ned Davis Research
PROBABILITY OF INCREASE IN STOCK MARKET NEXT YEAR
 Source: Haver Analytics, Gluskin Sheff
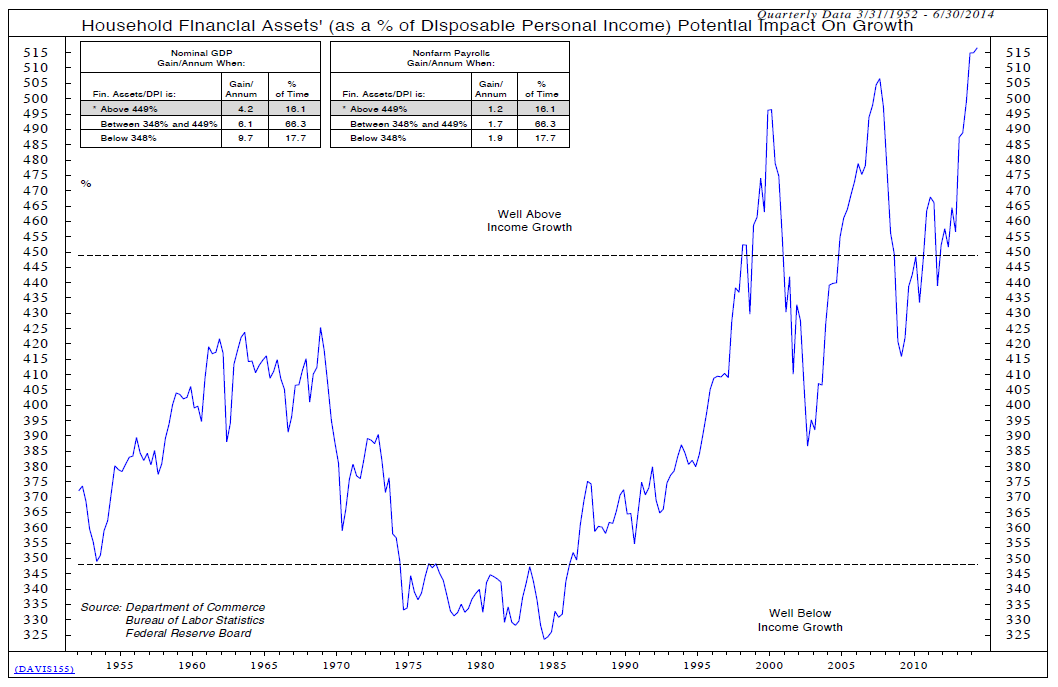 Source: Ned Davis Research
 Source: CMG Capital Management Group
RELATIVE FMS POSITIONING: EM EQUITIES VS. ENERGY STOCKS
 Source: BofA Merrill Lynch
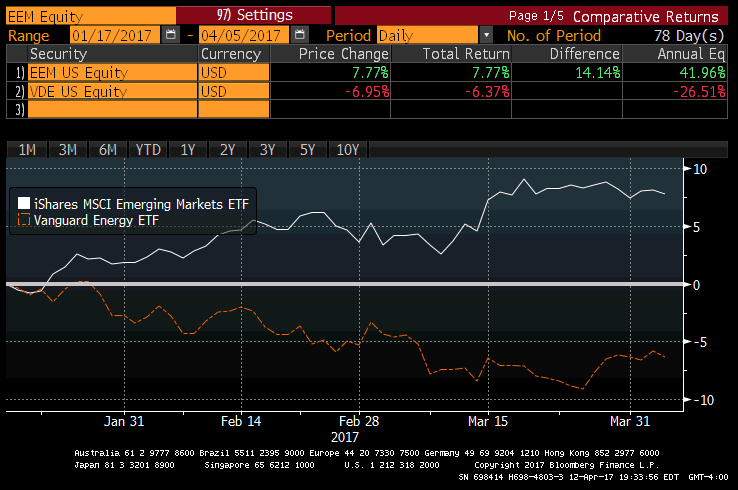 Source: Bloomberg, Evergreen Gavekal
- If ETFs (Exchange Traded Funds), mostly of the index variety, are the new magic solution, how come the father of indexing, Vanguard’s founder Jack Bogle, states that in the five years through 2009, investors realized 4.5% annually less on the ETFs they owned than the underlying indexes produced? (Hint: it wasn’t by buying when sentiment on the ETF in question was negative and selling when it was bullish.)
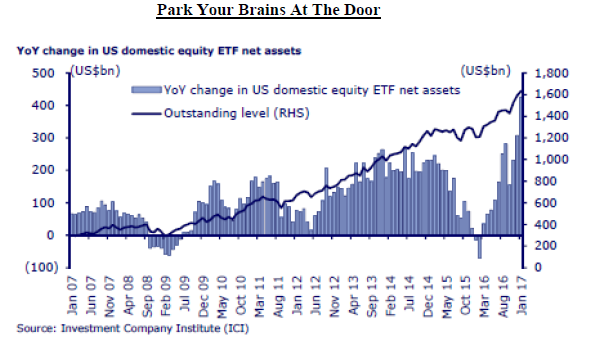 Source: The Credit Strategist
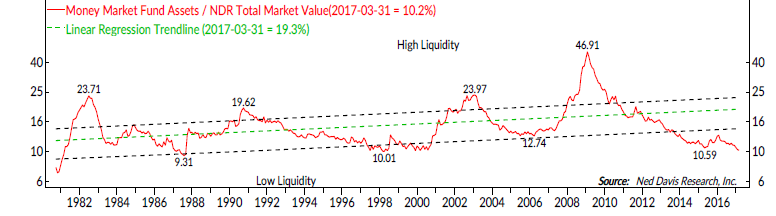
- If there is an alleged “mountain of cash” on the sidelines, primed to drive the market even higher, as we hear so often on CNBC, how come the current cash level relative to overall stock market valuation is the lowest in 17 years (per Ned Davis Research)?
 Source: Ned Davis Research
- If US stocks are reasonably priced, as we so often hear on bubblevision, why is it that the Dow is selling at its highest price-to-sales ratio ever? (Remember, it’s a lot easier for companies to inflate earnings than revenues.)
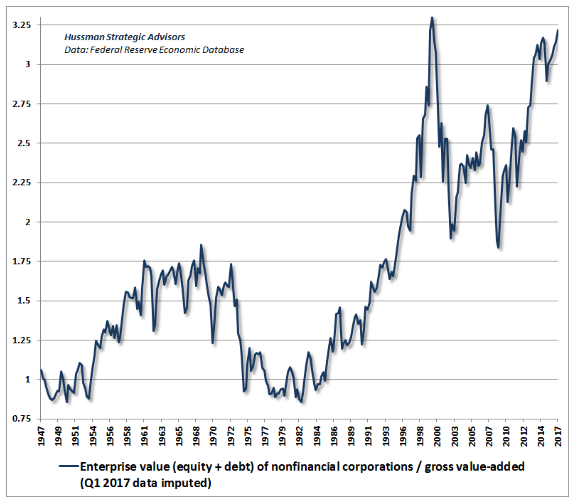
- Again, on the valuation front, if the market is not dangerously extended, why is it that on an enterprise value to gross valued-added basis (roughly equivalent to corporate GDP), the market is essentially as overpriced as it was in 1999, at the height of that monstrous bubble? (Enterprise value includes debt and is therefore a more comprehensive way of looking at total valuation than just focusing on stock market capitalization.)
 Source: Hussman Funds
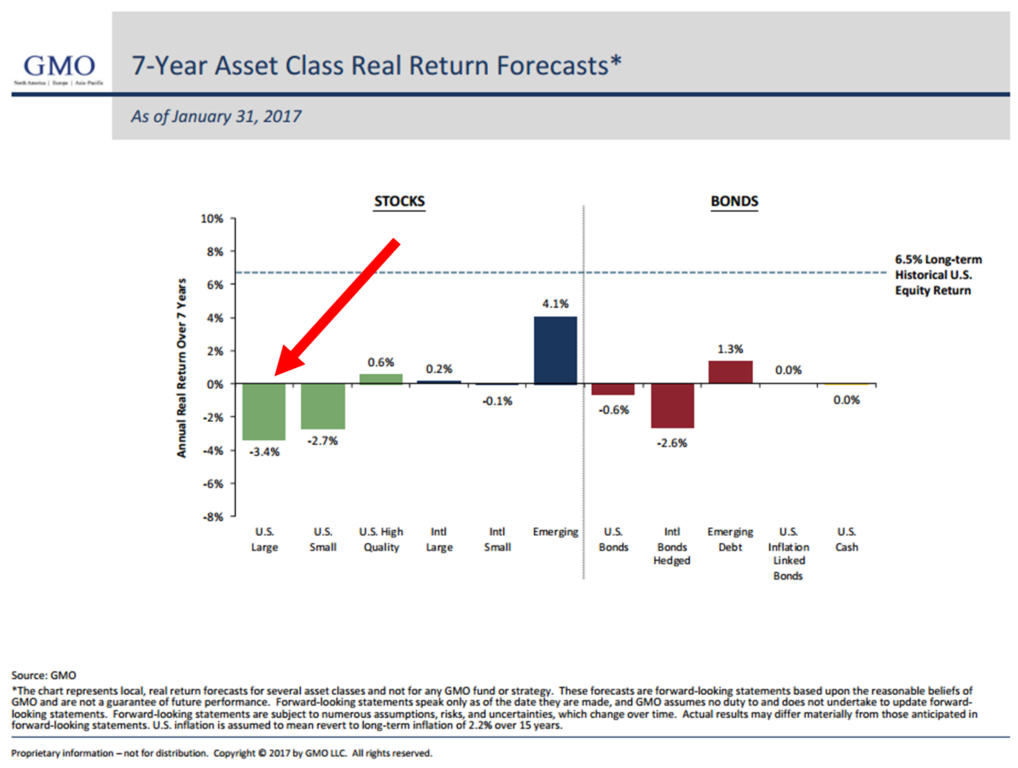
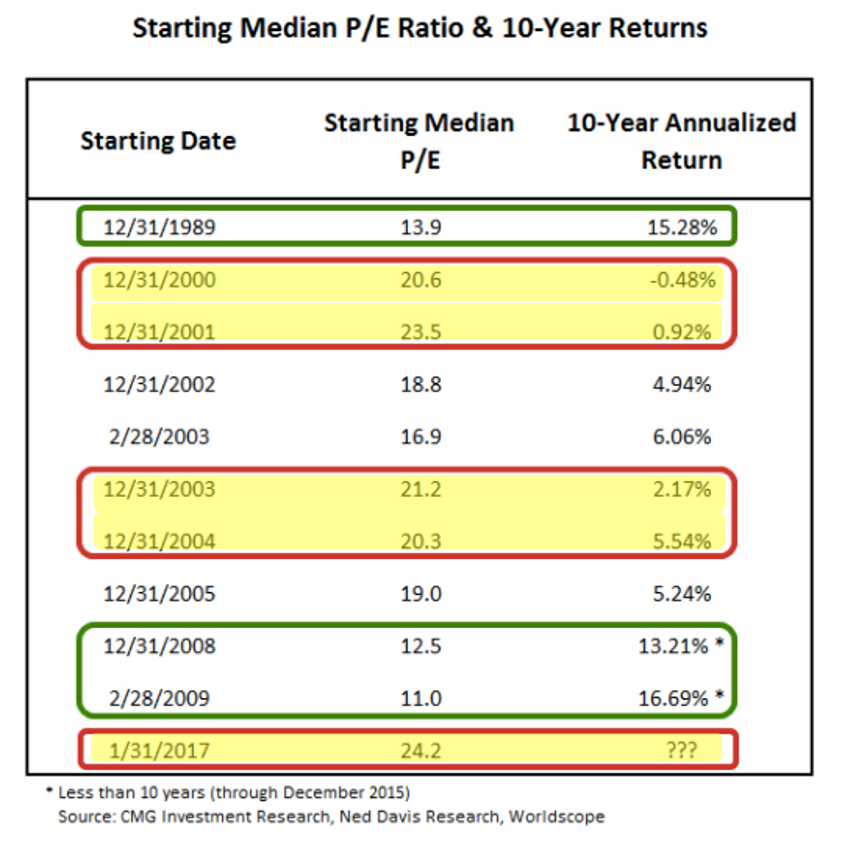
- If GMO’s low-to-negative return forecast is to be ignored, how come the table below shows that high P/E ratios (which are flattered by generous earnings calculations) clearly reveals how consistently overvaluation leads to poor future gains? (What makes this more sobering is that the period since the late 1980s has been characterized by the highest P/E ratios in market history. In other words, if earnings multiples had receded back to previous levels, the returns from these starting points would have been materially worse.)
 Source: Mauldin Economics
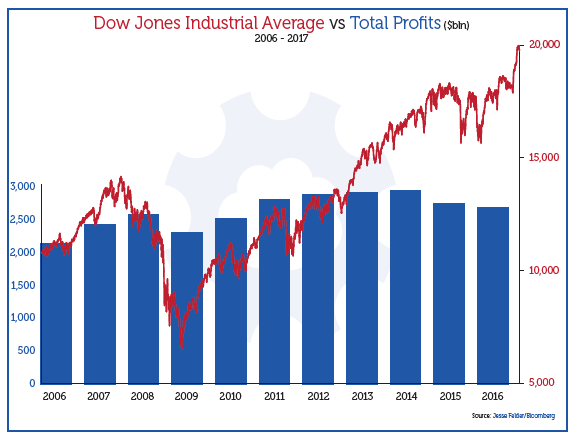
- If optimists are all pumped up over the prospect of better corporate earnings, how come there has been absolutely no connection between the drop in total profits for the 30 Dow Industrial Average companies since 2012 and their stock prices? (In other words, there is a lot of a catching up to do on the earnings front. That may be quite challenging—regardless of what Wall Street is predicting—at this very late stage of the economic cycle.)
 Source: Grant Williams
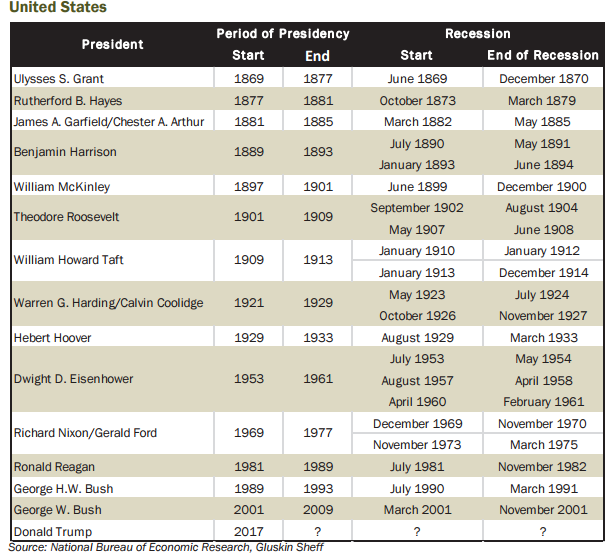
- Why is it that nearly every economist and strategist believes that a recession is nowhere on the horizon when the economy has contracted—or continued to shrink—during the first term of every GOP president back to the Civil War? (Past EVAs have noted this tendency since 1928 but the ever-vigilant David Rosenberg has gone all the way back to Ulysses S. Grant.)
GOP PRESIDENTS AND RECESSIONS
 Source: Haver Analytics, Gluskin Sheff
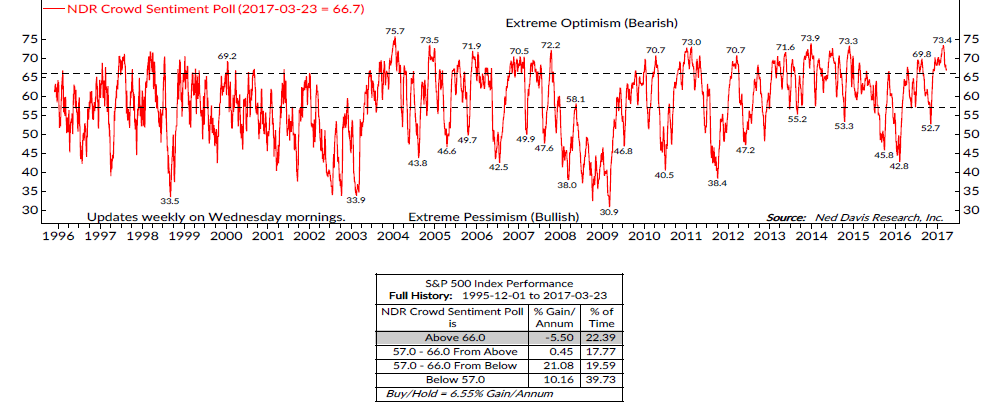
- One last question: Does the above mean that stocks are in immediate jeopardy? Not at all. In fact, Ned Davis Research’s primary trend-tracking indicator, which has had nearly a flawless track record, remains bullish. But it does mean that investors need to be prepared for a major reversal soon. It’s a dangerous game to be profit-seeking at this extremely advanced point in the market cycle, one suited for only the most agile of traders. Further, based on the fact that current overall sentiment and speculative positioning toward stocks is ragingly bullish—and we are heading into the historically difficult May to October period—another correction may be imminent. It’s unlikely to be the Ursine Major—or big, bad bear market—Charles Gave and I have warned about for some time. But it’s coming.
 Source: Ned Davis Research
 David Hay
Chief Investment Officer
To contact Dave, email:
dhay@evergreengavekal.com
David Hay
Chief Investment Officer
To contact Dave, email:
dhay@evergreengavekal.com
OUR CURRENT LIKES AND DISLIKES
No changes this week.
LIKE
- Large-cap growth (during a correction)
- International developed markets (during a correction)
- Canadian REITs
- Cash
- Publicly-traded pipeline partnerships (MLPs) yielding 7%-12%
- Intermediate-term investment-grade corporate bonds, yielding approximately 4%
- Gold-mining stocks
- Gold
- Intermediate municipal bonds with strong credit ratings
- Select blue chip oil stocks (on a pull back)
- Emerging bond markets (dollar-based or hedged); local currency in a few select cases
- Investment-grade floating rate corporate bonds
- Mexican stocks
- Solar Yield Cos on a pull-back (and profit-taking for tax deferred accounts, in some cases)
- Long-term municipal bonds
- Long-term Treasury bonds
- Long-term investment grade corporate bonds
NEUTRAL
- Most cyclical resource-based stocks
- Short-term investment grade corporate bonds
- High-quality preferred stocks yielding 6%
- Short yen ETF (closing out positions and removing)
- Emerging market bonds (local currency)
- Short euro ETF (sell a portion for solid gain)
- Bonds denominated in renminbi trading in Hong Kong (dim sum bonds)
- Canadian dollar-denominated bonds
- Mid-cap growth
- Emerging stock markets, however a number of Asian developing markets, ex-India, appear undervalued (taking profits on India)
- Floating-rate bank debt (junk)
- Select European banks
- BB-rated corporate bonds (i.e., high-quality, high yield)
DISLIKE
- US-based Real Estate Investment Trusts (REITs) (once again, some small-and mid-cap issues appear attractive)
- Small-cap value
- Mid-cap value
- Small-cap growth
- Lower-rated junk bonds
- Large-cap value
DISCLOSURE: This material has been prepared or is distributed solely for informational purposes only and is not a solicitation or an offer to buy any security or instrument or to participate in any trading strategy. Any opinions, recommendations, and assumptions included in this presentation are based upon current market conditions, reflect our judgment as of the date of this presentation, and are subject to change. Past performance is no guarantee of future results. All investments involve risk including the loss of principal. All material presented is compiled from sources believed to be reliable, but accuracy cannot be guaranteed and Evergreen makes no representation as to its accuracy or completeness.