

Click here to view as PDF. “It takes character to sit there with all that cash and do nothing. I didn’t get to where I am going after mediocre opportunities.” -CHARLIE MUNGER, Warren Buffett’s longtime partner “In recent years, holding cash is so completely out of favor that it has become the ultimate contrarian investment.” -SETH KLARMAN, one of the most successful money managers over the past three decades
RANDOM THOUGHTS
Time for a surreality check. Somehow, I don’t think I’m alone in waking up on certain mornings wondering into what parallel universe I’ve been transported. The daily surreality show I’m referring to includes, but is not limited to, watching what are decidedly unpresidential press conferences by our new president—not to mention an endless stream (of consciousness) tweets—and shockingly public feuds with the US intelligence community. These recurring events have caused global uncertainty surveys to go postal.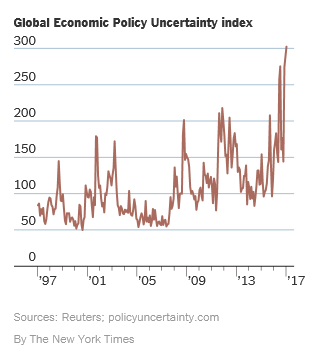 Source: The New York Times
CONFIDENCE BACK TO PRE-RECESSION LEVELS
 Source: Evergreen GaveKal, Bloomberg
 Source: BCA Research
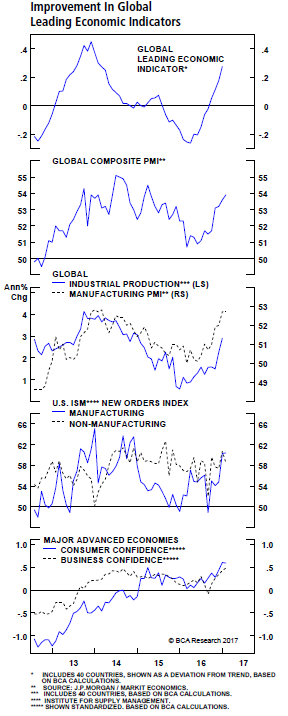
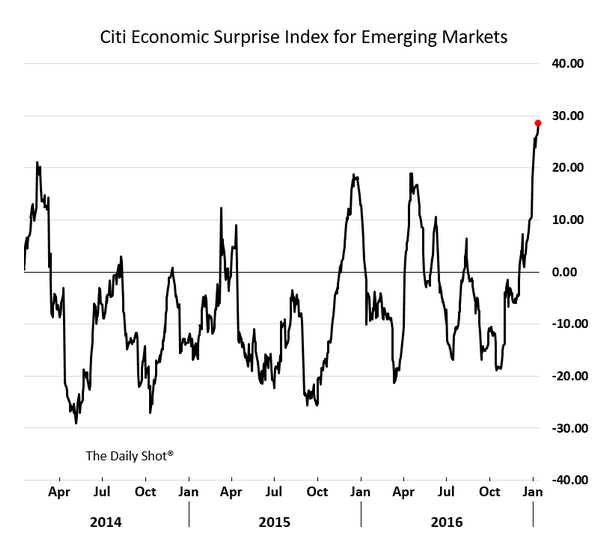
LEADING INDICATORS AND BUSINESS CONDITIONS IMPROVING GLOBALLY, INCLUDING IN THE DEVELOPING WORLD
Source: Wall Street Journal
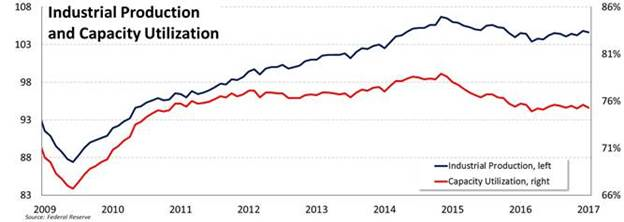
Further indicating this is more than just a sentiment phenomenon, the Wall Street Journal has reported that container imports into the key ports of LA and Long Beach were up 7.8% in December of last year vs 2015. Perhaps of greater significance, exports popped an even more vigorous 11.8% compared to December of 2015. Market and economic bulls should pray that this type of self‐fulfilling cycle continues. Despite the sudden optimism, the US manufacturing sector needs all the help it can get. And, of course, reviving smokestack America is the cornerstone of Trumponomics. Unfortunately, industrial production has been in a downtrend since late 2014. Meanwhile, capacity utilization remains in quasi-recessionary territory.THE TREND IS NOT THE FRIEND OF THE US INDUSTRIAL SECTOR
 Source: FTN Financial, Federal Reserve
 Source: Wall Street Journal
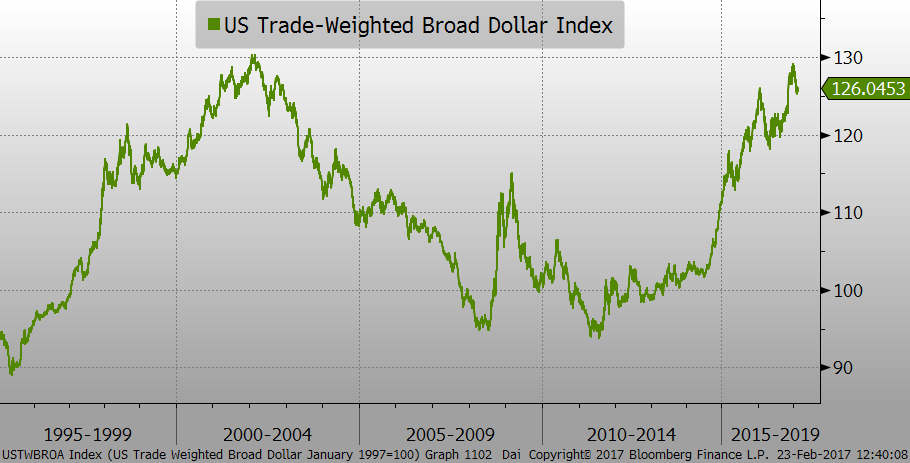
“KING DOLLAR” BACK ON ITS THRONE
 Source: Evergreen GaveKal, Bloomberg
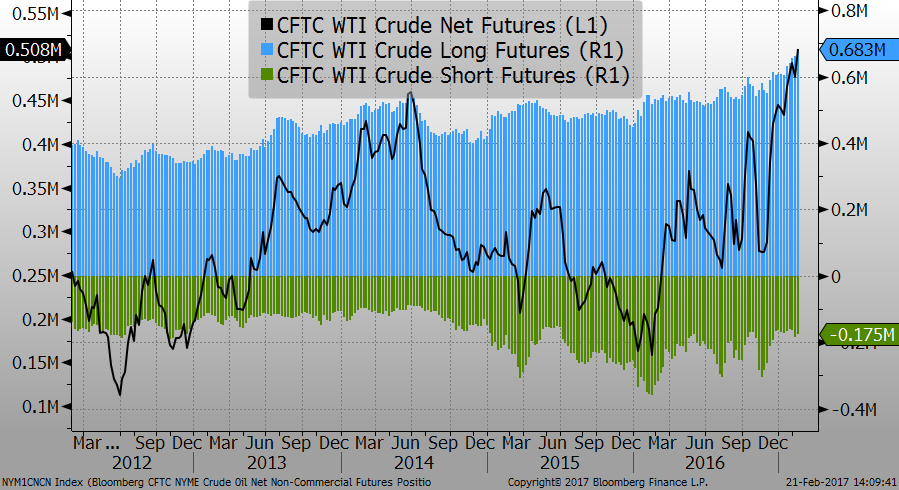
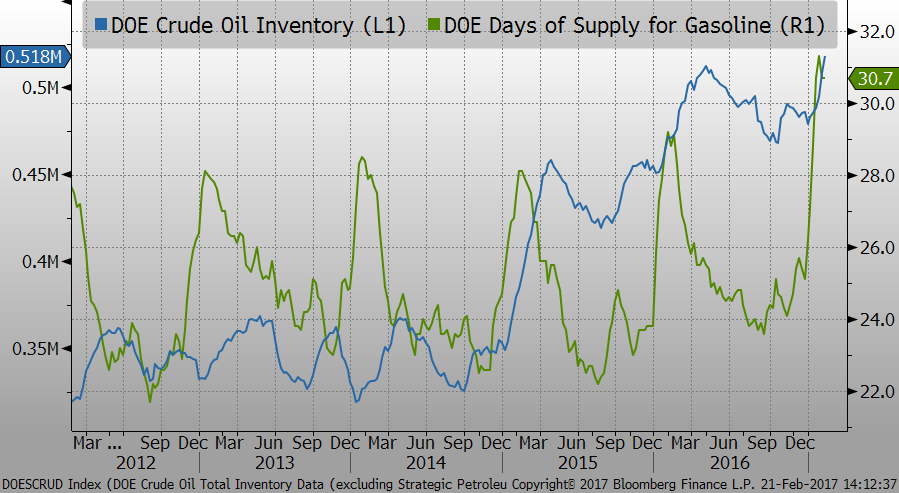
What a difference a year makes! Perceptive EVA readers may have noticed over time that we tend to write a lot about an investment area when it is either extremely popular or widely detested. Once our viewpoint is vindicated (a process, unfortunately, that can sometimes take years) we tend to go quiet. A case in point a decade ago was housing. We published a long string of EVAs in 2006 and 2007 on what we felt were the grave dangers posed by the unprecedented overinvestment in housing back then, much of it financed with funny‐money mortgages. Once the hyper‐speculative helium was fully squeezed out of that Hindenburg‐size dirigible, we have largely maintained radio silence on housing. On the other hand, in 2015, energy was the victim of what we would characterize as an “anti‐bubble”. Instead of frenzied and leveraged buying, the oil and gas sector was repeatedly subjected to mass selling, hitting a crescendo in February of last year. Its ordeal was magnified by the unwinding of leveraged participants such as hedge funds and closed‐end mutual funds (which often use roughly 30% leverage). This deleveraging process saw three different episodes of forced liquidation during the second half of 2015 and into 2016. The reason it’s referred to as “forced” is because deep drops in market values cause minimum margin requirements to be violated. In turn, this causes brokerage firms to issue the dreaded margin calls. Often investors don’t have the cash to pony up, forcing positions to be sold, putting further downward pressure on the asset in question, triggering additional margin calls and another round of forced selling. It was this chain‐reaction that caused the 1929 crash to be so disastrous back when as much as 90% of a stock’s purchase price could be borrowed. As we wrote during the latter half of 2015 and early 2016, energy’s implosion was a déjà-vu-2008-all-over-again event. During the financial crisis, involuntary selling due to mass margin calls occurred in almost everything and it was, as we vehemently declared in 2008, the buying opportunity of several generations. This was particularly the case with yield securities like corporate bonds, preferred stocks, and master limited partnerships (MLPs). As long-time EVA readers likely recall, it was on those securities that we were forcefully pounding the proverbial table in late 2008 and through much of 2009. Based on both our warnings of the coming housing implosion, and our exhortations to capitalize on the chaos it caused, we thought we might have earned some “cred”. Unfortunately, even though we had warned energy was overvalued in 2014, prior to its collapse, our credibility capital proved to be pretty thin. It’s no exaggeration (though I wish it was) to say that we took a lot of heat during the late stages of the energy crash. We found ourselves repeatedly, and not very successfully, defending MLPs, those defensive operators of dependable “mid‐stream” energy assets, such as pipelines and hydro‐carbon storage facilities. Incredibly, MLPs fell 60% from their peak in mid‐2014 to their nadir in early February, 2016, as they became one of the main victims of the margin‐driven selling. This was a total reenactment of their epic plunge during the Great Recession, a sheer cliff‐dive we wrongly believed would never happen again, at least in my advanced lifetime. It became fashionable in 2015 to hate on, as the kids say, MLPs, referring to them as having broken business models and being little more than Wall Street fee‐generating schemes. Short‐sellers pounced on the group, with the media giving them ample coverage. This created a further piling‐on effect, taking them down to the point where some were yielding 20%. By early 2016, Jim Cramer declared to the world that no MLP payout was safe. Jimbo’s panicky declaration almost precisely coincided with the bottom in the sector and a subsequent 60% rocket-recovery. Certainly, there were a few MLPs that cut distributions, including one of the biggest (which had actually recently converted to a C‐corp). But the majority maintained their payouts, with the strongest continuing to increase them. Most of those 20% yielders also sustained their distributions and over the last year they are up in the 300% range. Fortunately, Evergreen held onto its MLP exposure (with clenched and sweaty fists) and methodically added to them through the repeated waves of selling. To be fair, the speed of this recovery has surprised even us and we were one of the few remaining bulls a year ago on MLPs in specific, and energy in general. (A hundred or so Evergreen clients may recall attending our special “buy energy” conference we put on last March; suffice to say, our timing was fortuitous.) But we did think a big rally was coming, in no small measure because extreme negativity and mass forced liquidation have always been epic money‐making opportunities. Today is a very different story, however. Yes, MLPs remain almost 40% off their mid‐2014 apex but many other energy securities are beginning to appear fully-, if not over‐, valued. Instead of the end‐of‐the world‐mentality that prevailed a year ago, present positioning in crude oil is one of the most bullish on record. Yet, despite this rampant euphoria, inventories of both crude and refined products, like gasoline, are both Himalayan high.
SPECULATORS UBER-BULLISH ON OIL: LONG AND WRONG?
 Source: Evergreen GaveKal, Bloomberg
SWIMMING IN OIL
 Source: Evergreen GaveKal, Bloomberg
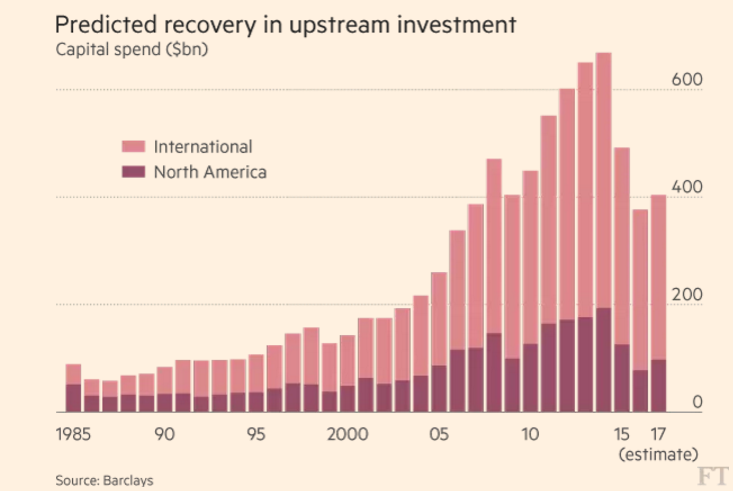
CAPITAL EXPENDITURE (CAP EX) DEPRIVATION IN THE ENERGY SECTOR
 Source: Financial Times
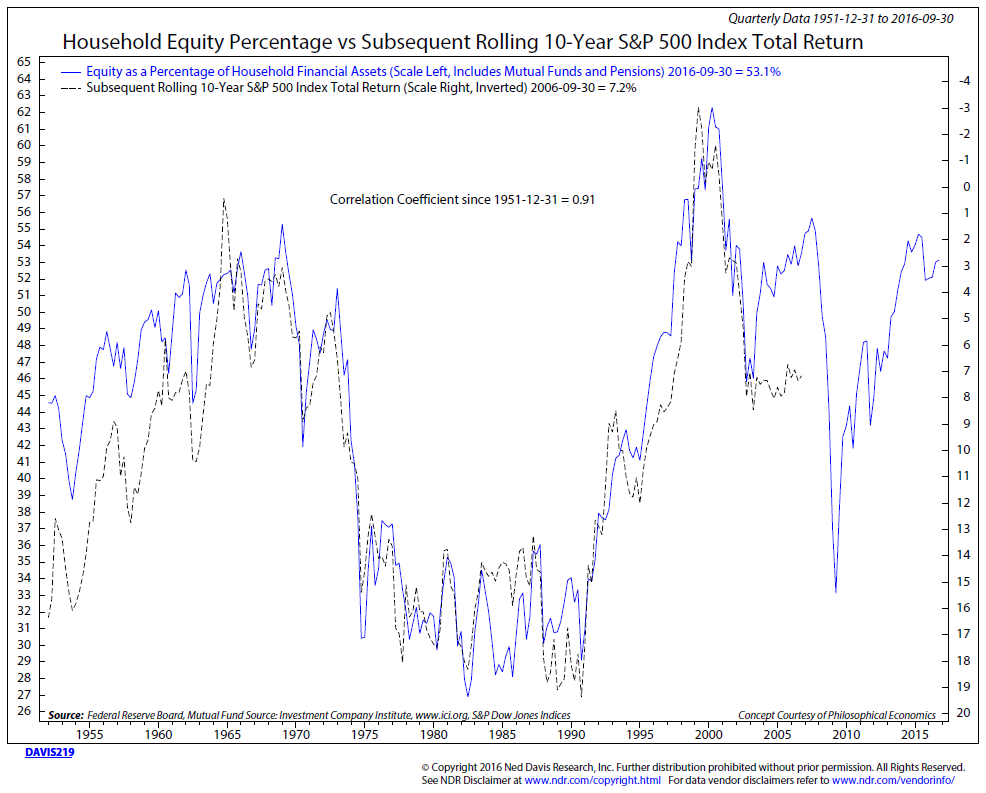
What bubble? We humans are such a bundle of biases. A case in glaring point is our current president. He has gone from decrying the bubblefied stock market into touting the $2 trillion of stock market wealth that has been “created” since he was elected. Lost in this back‐patting, are the trillions lost by global bond markets since November. The connection between stocks and bonds brings up an intriguing view of their twin valuations highlighted by the ever-observant Mike O’Rourke, author of Jones Trading’s The Closing Print. Much financial press ink has been expended discussing how reasonably priced stocks are relative to bonds. Yet, as supernova‐bright folks like David Rosenberg and John Hussman have pointed out, the reality is that very low yields on fixed‐income have, in actuality, historically coexisted with subdued price/earnings ratios. (This is due to the reality that rock‐bottom rates reflect dour future growth prospects, such as the “secular stagnation” phase we’ve been in for years, at least prior to Mr. Trump’s win.) But what Mike has pointed out puts a different twist on this. He notes that if you look at the combined valuation of stocks and bonds (high P/Es, low yields), a 60% stock/40% bond portfolio is trading in the first percentile going back to the early 1960s. In English, this means that the combined valuation of stocks and bonds is more expensive than 99% of the instances over the past 55 years. (Click here to access Mike’s relevant piece on this from 1/4/17.) Showing we are not alone in being captivated by this factoid, Barron’s ran this in one of their feature columns last month. This week Barron’s weekly “Up and Down Wall Street” column by Randall Forsythe also pointed out that Mr. Trump has the handicap of inheriting a stock market trading at 22.5 times normalized earnings. This is compared to 11.5 times normalized earnings when Mr. Obama moved into the Oval Office. (“Normalized earnings” are based on mid‐cycle profit margins, i.e., margins that are not at a peak or a trough.) Mr. Forsythe, quoting Leuthold Group’s chief investment officer, Doug Ramsay, notes that Democrats have typically been elected when markets are depressed, while the GOP’s winner usually comes in when share prices are dear (Ronald Reagan was a notable exception to this rule). Accordingly, stocks have returned 48.6% under Democratic administrations, nearly double the 24.7% produced during Republican presidential terms. It’s been awhile since we’ve referred to Ned Davis Research’s views of stock valuations so I thought it’s time for a refresh from those sagacious market observers, as well. One point Ned Davis—the man himself—has repeatedly made is that when stocks are at a high level of household assets, future returns are always low.
WHEN INVESTORS HAVE HIGH STOCK ALLOCATIONS, LOW RETURNS ARE INEVITABLE
 Source: Ned Davis Research
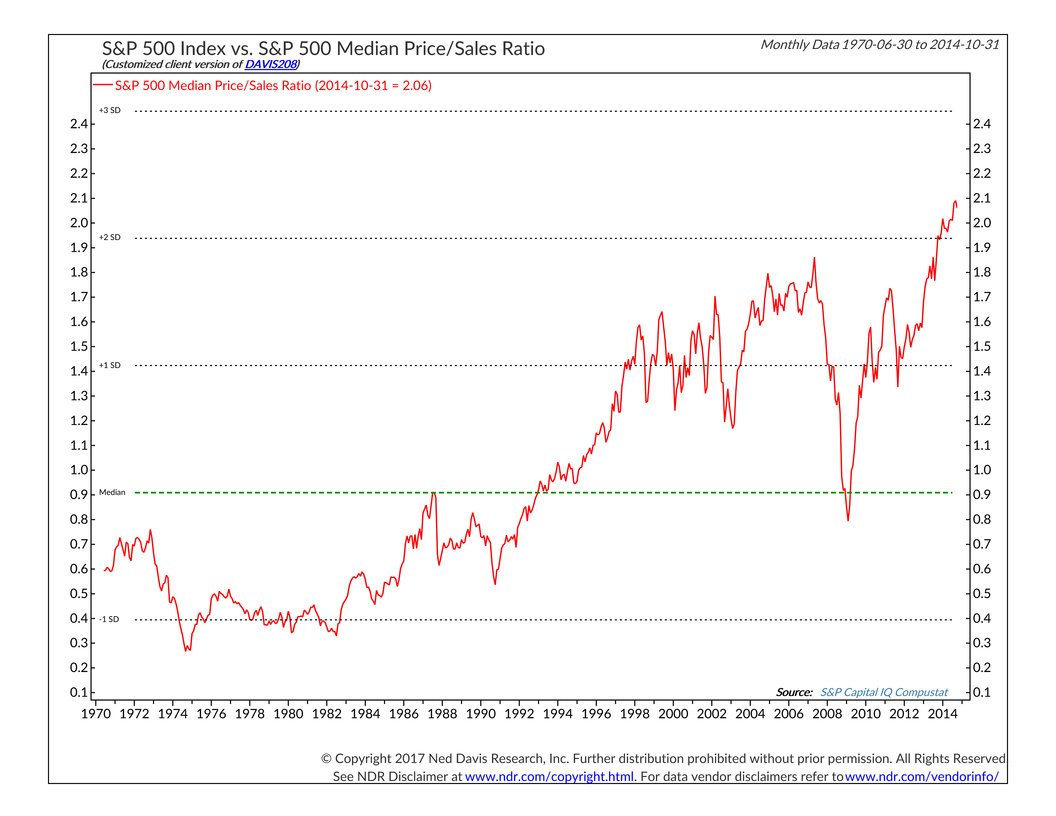 Source: Ned Davis Research
Pushing on a debt string. The penultimate section of this week’s EVA is intended to be like a mini‐version of one of our Chartbooks. This is because I wanted to show you how many charts on lending are sending the same message. And it’s a story that, frankly, surprises me.
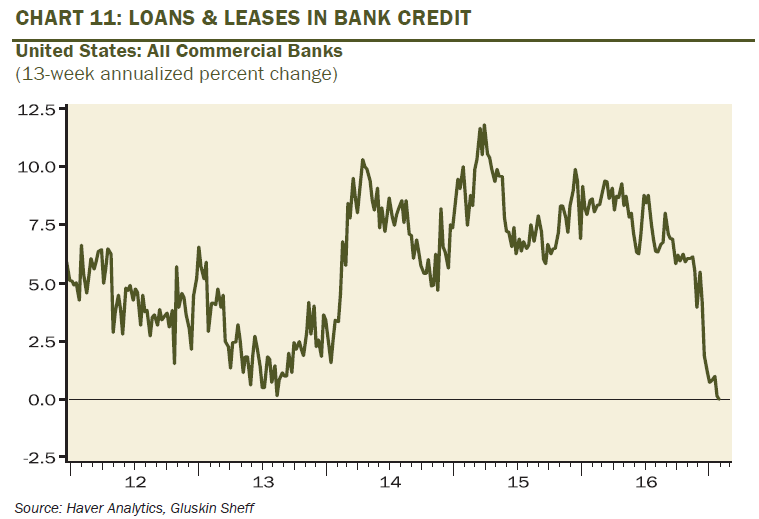
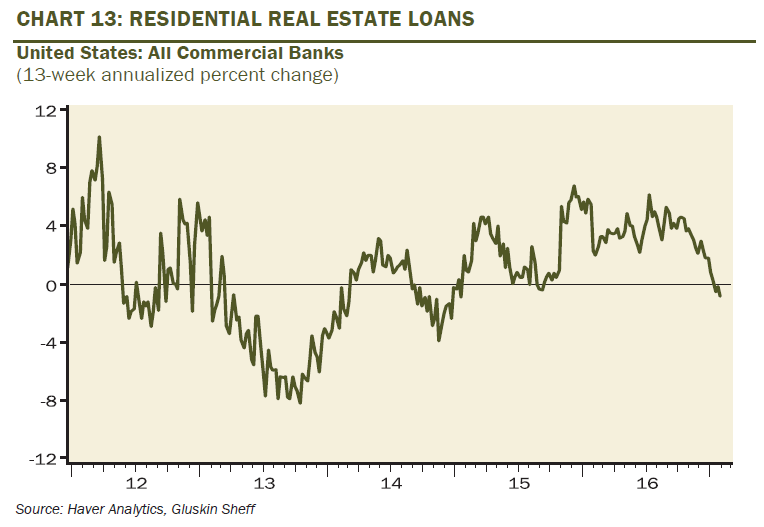
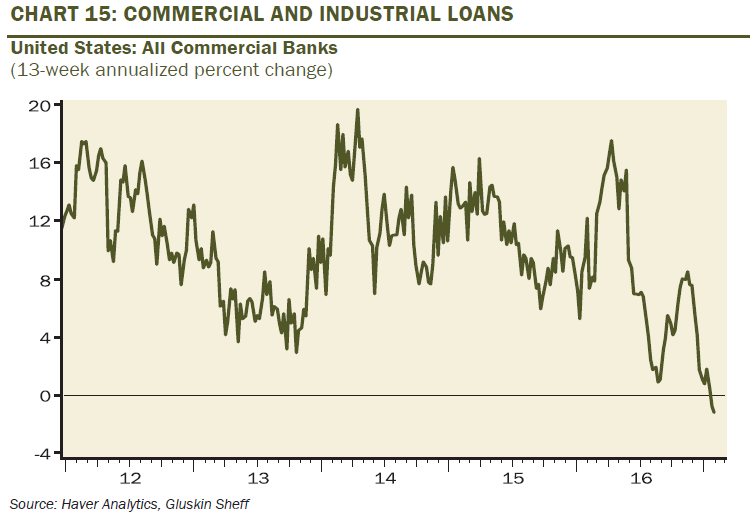
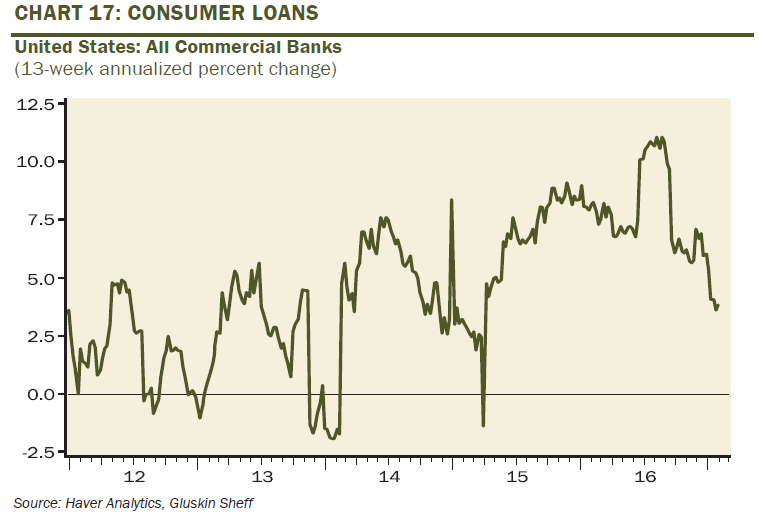
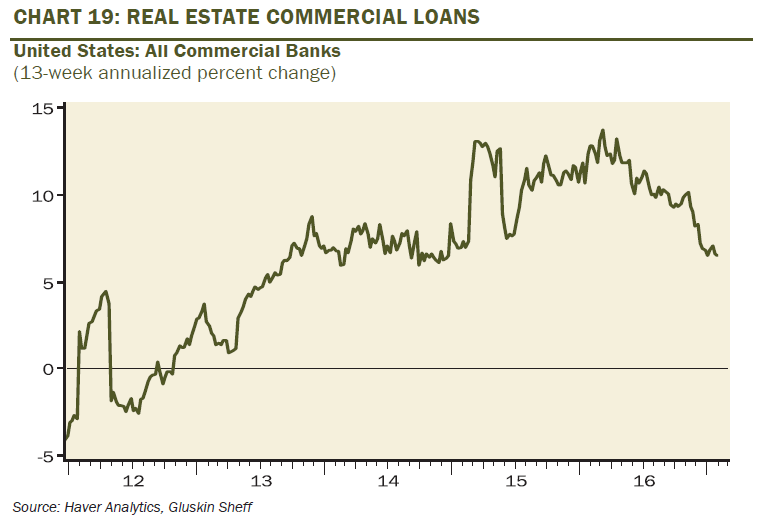 Even to the economically untrained eye, you can see that what is happening is totally at odds with the swelling confidence and better economic tone mentioned earlier. You would think that with so‐called “animal spirits” running wild, banks would be finally willing to lend out their abundant reserves and borrowers would be avidly seeking to take advantage of that largesse.
In turn, this should also reverse the long downtrend in money velocity. But, so far, there is no indication money velocity is turning up. It’s possible there’s a lag effect but based on the above charts it seems improbable. Therefore, it’s reasonable to consider why lending is cooling rather than heating.
In order to attempt to resolve this conundrum, I thought it would be helpful to turn to the venerable Lacy Hunt. Dr. Hunt may be the only economist known to mankind who also runs a bond fund—and not just any bond fund. As noted in prior EVAs, he is co‐manager of the Wasatch-Hoisington Treasury Fund which has compiled one of the finest long‐term track records in the fixed‐income world.
Jim Grant—he of an endless supply of bow ties and CNBC appearances—quoted Lacy in the February 13th issue of his storied newsletter, Grant’s Interest Rate Observer. Mr. Grant, too, was commenting on the recent curtailment of lending and also M2 (otherwise known as the US money supply) and speculated that it might have to do with “credit already incurred”. In other words, good reader, the US is “debted out”. Per Lacy, America’s private and public IOUs total about $69 trillion (ignoring off balance sheet Federal liabilities like Medicare and Medicaid). He estimates about $20 trillion of this will have an interest rate reset over the next two years. Based on the rate rise that’s already happened (due to Fed hikes and new money market rules that have pushed LIBOR [London Interbank Offered Rate] over 1%), Lacy ballparks about $200 billion of increased interest costs.
Perhaps this is why the number of US car owners falling behind on their payments is back to 2009 levels, when we were still mired in the Great Recession. Similarly, current delinquencies on credit card debt are the most elevated since 2011.
Dr. Hunt has also repeatedly made the point in print and in presentations (several of which I’ve been privileged to attend), that the overarching problem is debt levels are simply too high, making it extremely challenging to enjoy past economic growth rates when heaping on new borrowings stoked activity. Unfortunately, there’s nothing Mr. Trump can do about that—unless he’s got a magic wand to wipe away debt without all the horrors of actually defaulting. You may remember Mr. Trump flirted with the “D” word on the campaign trail. Let’s hope he was not to be taken either seriously or literally on that one.
Even to the economically untrained eye, you can see that what is happening is totally at odds with the swelling confidence and better economic tone mentioned earlier. You would think that with so‐called “animal spirits” running wild, banks would be finally willing to lend out their abundant reserves and borrowers would be avidly seeking to take advantage of that largesse.
In turn, this should also reverse the long downtrend in money velocity. But, so far, there is no indication money velocity is turning up. It’s possible there’s a lag effect but based on the above charts it seems improbable. Therefore, it’s reasonable to consider why lending is cooling rather than heating.
In order to attempt to resolve this conundrum, I thought it would be helpful to turn to the venerable Lacy Hunt. Dr. Hunt may be the only economist known to mankind who also runs a bond fund—and not just any bond fund. As noted in prior EVAs, he is co‐manager of the Wasatch-Hoisington Treasury Fund which has compiled one of the finest long‐term track records in the fixed‐income world.
Jim Grant—he of an endless supply of bow ties and CNBC appearances—quoted Lacy in the February 13th issue of his storied newsletter, Grant’s Interest Rate Observer. Mr. Grant, too, was commenting on the recent curtailment of lending and also M2 (otherwise known as the US money supply) and speculated that it might have to do with “credit already incurred”. In other words, good reader, the US is “debted out”. Per Lacy, America’s private and public IOUs total about $69 trillion (ignoring off balance sheet Federal liabilities like Medicare and Medicaid). He estimates about $20 trillion of this will have an interest rate reset over the next two years. Based on the rate rise that’s already happened (due to Fed hikes and new money market rules that have pushed LIBOR [London Interbank Offered Rate] over 1%), Lacy ballparks about $200 billion of increased interest costs.
Perhaps this is why the number of US car owners falling behind on their payments is back to 2009 levels, when we were still mired in the Great Recession. Similarly, current delinquencies on credit card debt are the most elevated since 2011.
Dr. Hunt has also repeatedly made the point in print and in presentations (several of which I’ve been privileged to attend), that the overarching problem is debt levels are simply too high, making it extremely challenging to enjoy past economic growth rates when heaping on new borrowings stoked activity. Unfortunately, there’s nothing Mr. Trump can do about that—unless he’s got a magic wand to wipe away debt without all the horrors of actually defaulting. You may remember Mr. Trump flirted with the “D” word on the campaign trail. Let’s hope he was not to be taken either seriously or literally on that one.
Oops. The final section of this Random Thoughts EVA will be very brief (no applause, please). As I indicated in my introduction, regarding my list of 10 potential surprises for this year, there is one that now looks even more improbable: my speculation that France would elect Francois Fillon as its next president, causing French stocks to be one of the best performers this year (the latter part of this being the truly non‐consensus view). Mr. Fillon’s stated goal is to roll‐back decades of encroaching socialism that have enfeebled the French economy and inhibited innovation (where are France’s equivalents of Apple, Google, and Facebook or even Germany’s SAP?) Shortly after we published my list, Mr. Fillon’s candidacy was dealt a nearly fatal blow due to investigations into his alleged use of government funds to pay several of his family members for questionable services rendered. His less than convincing denials, and subsequent waffling on the details of their employment history, caused even some members of his own party to float the idea of a replacement candidate. Despite this controversy, I’m going to reiterate that I think he can prevail, though the odds are clearly longer than they were last month. If Donald Trump and the Access Hollywood/Billy Bush scandal taught us anything, it is that a determined candidate, facing flawed opponents, can survive these incidents. And when it comes to politicians, finding one without flaws is like trying to locate a Russian athlete who hasn’t used blood-doping or performance-enhancing drugs. For example, Marine Le Pen, who had replaced Mr. Fillon as the front‐runner, had her offices raided by French police this week. This was based on allegations she and other senior leaders of her Front National party have illegally diverted European Union (EU) funds. We suspect all of the leading French candidates have a lot of baggage—and carry‐ons, too. If Madame Le Pen wins, however, Europe is likely to be severely shaken based on her virulently anti-EU views. In fact, the whole world is likely to be rocked, with a more lasting negative impact than was seen with Brexit last summer. Should the Continent be facing “Frexit” in the months ahead, that will stick a dagger in the heart of the entire European integration project with potentially tumultuous consequences for the planet at large. Based on the extreme complacency of financial markets currently, that seems to Evergreen to be reason enough to err on the defensive side.
 David Hay
Chief Investment Officer
To contact Dave, email:
dhay@evergreengavekal.com
David Hay
Chief Investment Officer
To contact Dave, email:
dhay@evergreengavekal.com
OUR CURRENT LIKES AND DISLIKES
Changes noted in bold.
LIKE
- Large-cap growth (during a correction)
- International developed markets (during a correction)
- Canadian REITs
- BB-rated corporate bonds (i.e., high-quality, high yield)
- Cash
- Publicly-traded pipeline partnerships (MLPs) yielding 7%-12%
- Intermediate-term investment-grade corporate bonds, yielding approximately 4%
- Gold-mining stocks
- Gold
- Intermediate municipal bonds with strong credit ratings
- Select blue chip oil stocks (on a pull back)
- Emerging bond markets (dollar-based or hedged); local currency in a few select cases
- Investment-grade floating rate corporate bonds
- Mexican stocks
- Yield Cos on a pull-back (and profit-taking for tax deferred accounts, in some cases)
- Long-term municipal bonds
- Long-term Treasury bonds
NEUTRAL
- Most cyclical resource-based stocks
- Large-cap value
- Short-term investment grade corporate bonds
- High-quality preferred stocks yielding 6%
- Short yen ETF (closing out positions and removing)
- Emerging market bonds (local currency)
- Short euro ETF (sell a portion for solid gain)
- Bonds denominated in renminbi trading in Hong Kong (dim sum bonds)
- Canadian dollar-denominated bonds
- Mid-cap growth
- Long-term investment grade corporate bonds
- Emerging stock markets, however a number of Asian developing markets, ex-India, appear undervalued (taking profits on India)
- The Indian stock market
- Floating-rate bank debt (junk)
DISLIKE
- US-based Real Estate Investment Trusts (REITs) (once again, some small-and mid-cap issues appear attractive)
- Small-cap value
- Mid-cap value
- Small-cap growth
- Lower-rated junk bonds
DISCLOSURE: This material has been prepared or is distributed solely for informational purposes only and is not a solicitation or an offer to buy any security or instrument or to participate in any trading strategy. Any opinions, recommendations, and assumptions included in this presentation are based upon current market conditions, reflect our judgment as of the date of this presentation, and are subject to change. Past performance is no guarantee of future results. All investments involve risk including the loss of principal. All material presented is compiled from sources believed to be reliable, but accuracy cannot be guaranteed and Evergreen makes no representation as to its accuracy or completeness.