

Click here to view as PDF. “The more certain something is, the less likely it is to be profitable.” -JIM ROGERS, acclaimed investor and former partner of George Soros “You can’t buy what is popular and do well.” -WARREN BUFFETT Small-caps, large prices. It dawned on me in creating that section title how often those of us in the financial industry toss around the terms “large-cap, mid-cap, and small-cap”. Normal human beings probably get the general idea but not the essence. To explain, please allow me to bring up another oft-used moniker: blue chips. That’s likely a more familiar term to most investors but what you may not be aware of is that it comes from poker where the highest value chips are blue—or at least they used to be in bygone days. Grizzled market veterans also sometimes refer to smaller companies as red chips, the next level down in the poker pecking order. In days of less generous overall market valuations, the small-cap cut off point was a billion market capitalization (from which the abbreviation “cap” is derived). Capitalization is calculated by multiplying the price per share by the total number of shares outstanding. Thus, if a company has 100 million shares in existence and the current price per share is $10, then the total market “cap” is $1 billion. Today, that break-point is generally assumed to be around $2 billion. (FYI, underneath small-caps are micro-caps—those companies with less than $300 million of market value—and at rock-bottom are the nano-caps, with market caps below $50 million; if you’ve never heard of the latter, don’t feel bad—until last week, neither had I!) For much of US stock market history, blue chips have been considered worthy of a premium valuation relative to smaller, riskier companies. Certainly, that was the case in spades (to use another poker analogy) in the late 1990s. As you can see from the chart below, price-to-earnings ratios (P/Es) were much higher for large caps than they were for smaller companies at that time. Unquestionably, a major factor in this blue chip valuation premium was due to the bubble back then, particularly in large cap tech stocks, but also in some marquee names like GE, Gillette, Coke, and several other former market darlings.
FIGURE 1: LARGE-CAP VERSUS SMALL-CAP P/E 1990 TO 1999 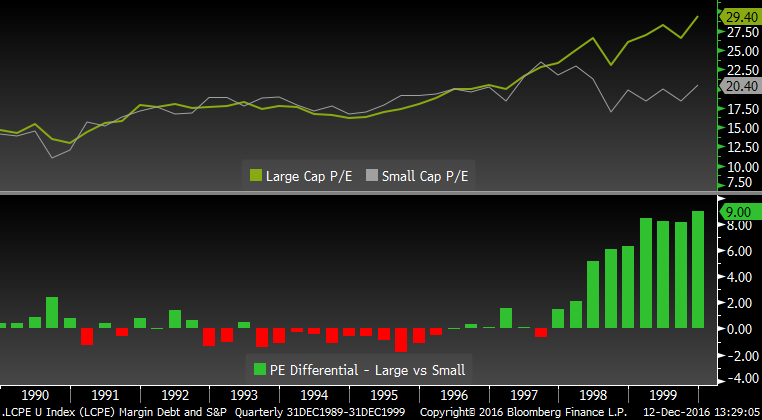 Source: Evergreen Gavekal, Bloomberg
FIGURE 2: SMALL-CAP VERSUS LARGE P/E 1999 TO PRESENT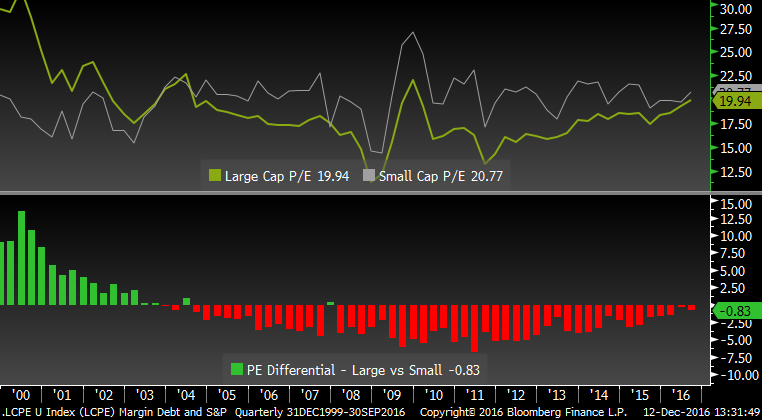 Source: Evergreen Gavekal, Bloomberg
FIGURE 3: TOTAL RETURN ON THE RUSSELL 2000 SMALL-CAP INDEX (ORANGE LINE)
VERSUS S&P 500 (WHITE LINE) SINCE 12/31/99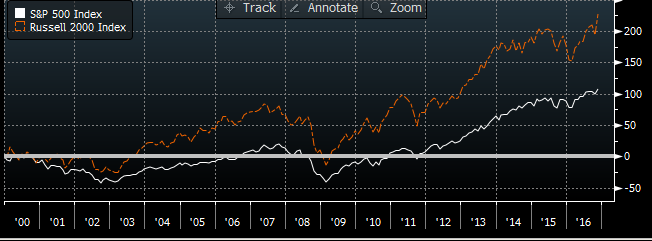 Source: Evergreen Gavekal, Bloomberg
FIGURE 4
FIGURE 5
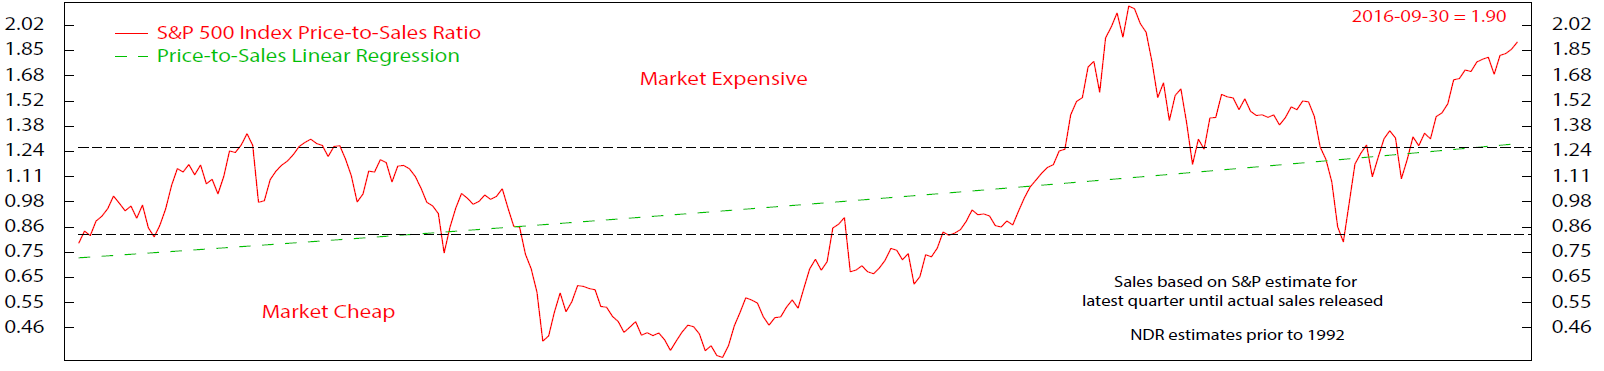
Source: Standard & Poor’s 500 Price/Sales Ratio, Ned Davis Research
Another way to view this disparity is to compare current P/E ratios of small- to large-caps. Per the chart below, it’s hard to argue that small-caps aren’t at a hefty premiumFIGURE 6: RELATIVE VALUATION OF SMALL-CAPS VERSUS LARGE-CAPS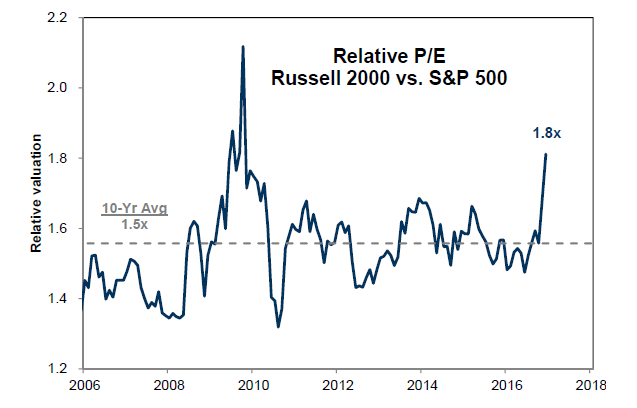
Source: Merrill Lynch
As is almost always the case, the recent pole-vault by small-caps has caused both speculators and the professional money management community (sometimes I wonder if there is a difference) to become almost unanimous in their anticipation of continuing outperformance. It’s noteworthy that the last time sentiment was this lopsided was right before small-caps entered a two-year lag phase within its 17-year de-cleeting of the Big Blues.FIGURE 7: NET SPECULATIVE LONG POSITION ON THE RUSSELL 2000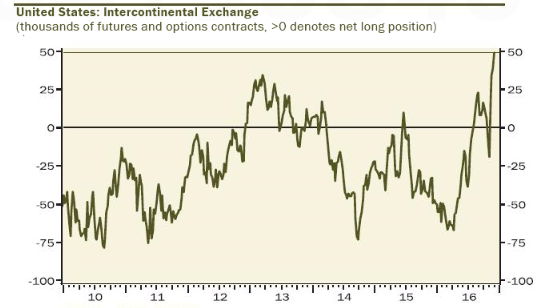
Source: Haver Analytics, Gluskin Sheff
FIGURE 8: NET % THINK LARGE-CAP WILL OUTPERFORM SMALL-CAP
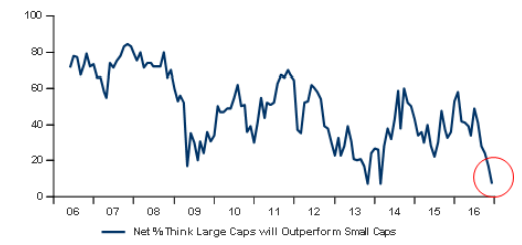
Source: BofA Merrill Lynch
Okay, it’s clear that small-caps are in rarefied valuation territory. But maybe they deserve it. Perhaps they are truly ideally suited for the advent of Trumponomics. That’s possible but please reflect on a few qualitative considerations. As noted by the esteemed research firm BCA (formerly, Bank Credit Analyst), rising domestic wages—a condition we have today—crimps profitability more at smaller firms than is the case for the big multinationals. Also, profit margins are consistently around half as high at small- versus large-cap firms. BCA further notes that from a market performance standpoint, small-caps usually lag when the Fed is tightening and also when risk-aversion surges (the latter is admittedly not a current condition, but that can happen in almost a nanosecond these days). Barclays strategist Venu Krishna has done some intriguing research on small-caps and found another notable downside. Russell (now owned by the London Stock Exchange) reshuffles its small- and large- (or at least larger-) cap index once a year. If a stock rises dramatically, it can “graduate” into the Russell 1000 Index of bigger companies. Should a company’s share price fall steeply enough, it can get demoted to the small-cap index. According to his analysis, this constant shift of stronger issues into the Russell 1000 and dumping off of the weaker companies into the Russell 2000 costs the small-index about 2.3% per year of return. But what about the persistent rallying cry that small-caps have a huge advantage when the dollar is upwardly mobile? Krishna points out that Russell 2000 companies derive around 21% of their revenue from overseas versus 33% for the Russell 1000 (overseas sales are higher yet for the S&P 500). Based on his research, this difference has led to a mere 1% outperformance by small-caps when the dollar has appreciated 10%. (Note that since the election the dollar is up 5%.) The late 1990s are an interesting case in point. The dollar was extremely strong during that era but, as you can infer from figure 1, large companies trounced smaller companies. Yet another oft-touted benefit is that over many decades they have produced materially higher returns. Although the Russell 2000 small-cap index was only created in 1979, market researchers have gone back as far as 1930 to show small-caps returning over 12.7% per year as opposed to 9.7% for the S&P 500. Yet, there is a price to pay for this additional return: greater volatility. And, as any veteran investment professional knows, volatility is toxic to the typical investor. It causes he or she to add money during boom phases and then bail out in a panicked frenzy during the plunges. This is why many mutual funds with high-but-erratic returns have produced such poor dollar-weighted (i.e., based on when investors buy and sell) performance results. It goes without saying, but I will anyway, that when small-cap stocks are richly valued versus the overall market, as is the case today, any return advantage is almost certain to be at least partially negated. With such extreme over-pricing today, it’s quite possible the red chips will lag the blue chips—and with more volatility, especially on the downside. In other words, small-caps could be poised to produce the worst of all possible investment worlds. The Price is Wrong. As a habitual—some might say, maniacal—watcher and reader of the financial media, I can’t tell you how many times I’ve heard pundits tout small-caps on the air and in print since the election. Yet, not once have I heard any of them bring up the valuation realities cited above. This gets to the very heart of how the markets operate these days when computers chase trends and humans seem incapable of discerning intrinsic value. If a theme—like overweighting small-caps—gets momentum behind it, for whatever reason, prices simply detach from reality for a time. And that time can last a lot longer than one would think rational (I can visualize many of you out there repeating John Maynard Keynes famous line: “The markets can stay irrational much longer than you can stay solvent”). Certainly, in the short-run, crazy-high valuations count for nothing, as the tech bubble proved in the late ‘90s and many other speculative frenzies have since. But, in the long run, they are everything. Lost in all the recent stock market euphoria is that despite extremely punchy P/Es and price-to-sales ratios for the S&P 500, its total return, as shown in figure 3 on page 3, has been an underwhelming 4.4% per year, including dividends, since 12/31/99. Even small-caps at 7.4% annually over that timeframe have merely matched the total return on a 10-year treasury note and with immensely more risk. Additionally, producing that return has inflated them to the nutty levels shown above. The reason for this is that valuations were ridiculous, particularly for large-caps, in 1999. Returns on both small- and large-caps had been far above normal for the prior 20 years, as you can see in figure 9 below. This left both styles poised for a long period of sub-par results—which is precisely what hapened. Even an unprecedented collapse by interest rates wasn’t able to overcome the return drag caused by extreme overvaluation.FIGURE 9: THE GOLDEN YEARS FOR STOCKS: RUSSELL 2000 (TOP) & S&P 500 (BOTTOM)
ANNUAL RETURNS 1979-1999 Source: Evergreen Gavekal, Bloomberg
 David Hay
Chief Investment Officer
To contact Dave, email:
dhay@evergreengavekal.com
______________________________________________________________________________________________________________
David Hay
Chief Investment Officer
To contact Dave, email:
dhay@evergreengavekal.com
______________________________________________________________________________________________________________
OUR CURRENT LIKES AND DISLIKES
See changes in bold.
LIKE
• Large-cap growth (during a correction) • International developed markets (during a correction) • Canadian REITs (take advantage of the recent pull-back) • BB-rated corporate bonds (i.e., high-quality, high yield) • Cash • Publicly-traded pipeline partnerships (MLPs) yielding 7%-12% • Intermediate-term investment-grade corporate bonds, yielding approximately 4% • Gold-mining stocks • Gold • Intermediate municipal bonds with strong credit ratings • Select blue chip oil stocks (on a pull back) • Emerging bond markets (dollarbased or hedged); local currency in a few select cases • Investment-grade floating rate corporate bonds • Mexican stocks • High-quality preferred stocks yielding 6%, selling at a discount from par value
NEUTRAL
• Most cyclical resource-based stocks • Large-cap value • Short-term investment grade corporate bonds • Short yen ETF • Emerging market bonds (local currency) • Short euro ETF • Bonds denominated in renminbi trading in Hong Kong (dim sum bonds) • Canadian dollar-denominated bonds • Long-term municipal bonds • Mid-cap growth • Long-term Treasury bonds • Long-term investment grade corporate bonds • Emerging stock markets, however a number of Asian developing markets, ex-India, appear undervalued • The Indian stock market • Intermediate Treasury notes • Select European banks
DISLIKE
• US-based Real Estate Investment Trusts (REITs) (once again, some small-and mid-cap issues appear attractive) • Small-cap value • Mid-cap value • Small-cap growth • Floating-rate bank debt (junk) • Lower-rated junk bonds
DISCLOSURE: This material has been prepared or is distributed solely for informational purposes only and is not a solicitation or an offer to buy any security or instrument or to participate in any trading strategy. Any opinions, recommendations, and assumptions included in this presentation are based upon current market conditions, reflect our judgment as of the date of this presentation, and are subject to change. Past performance is no guarantee of future results. All investments involve risk including the loss of principal. All material presented is compiled from sources believed to be reliable, but accuracy cannot be guaranteed and Evergreen makes no representation as to its accuracy or completeness.