

Click here to view as PDF. “I never give them hell. I just tell them the truth and they think it’s hell.” -Harry S. Truman, aka, “Give ‘em hell, Harry”
SUMMARY
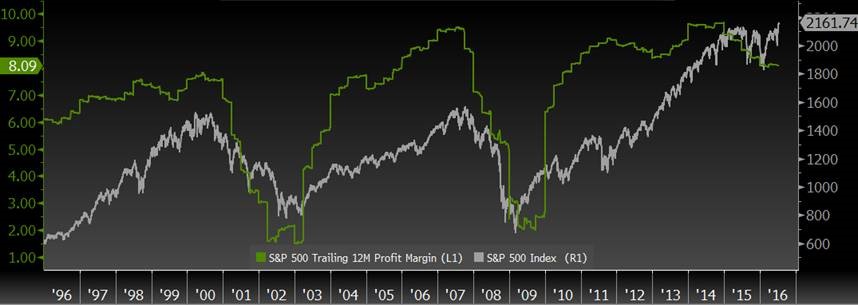
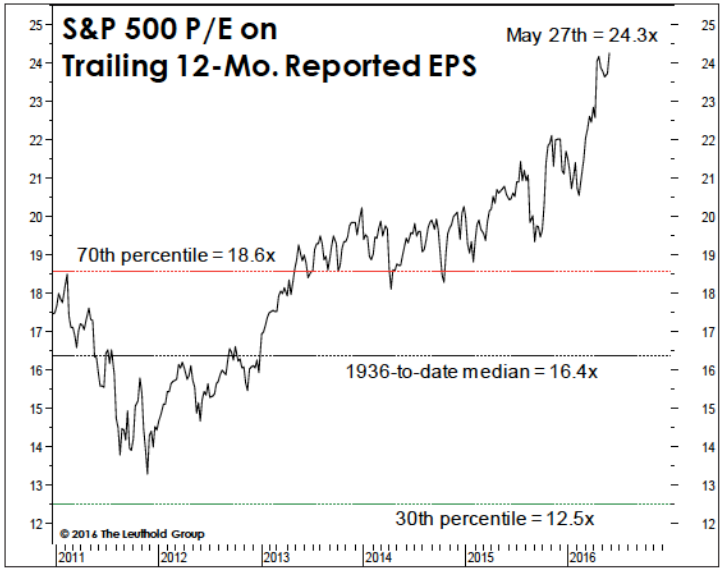
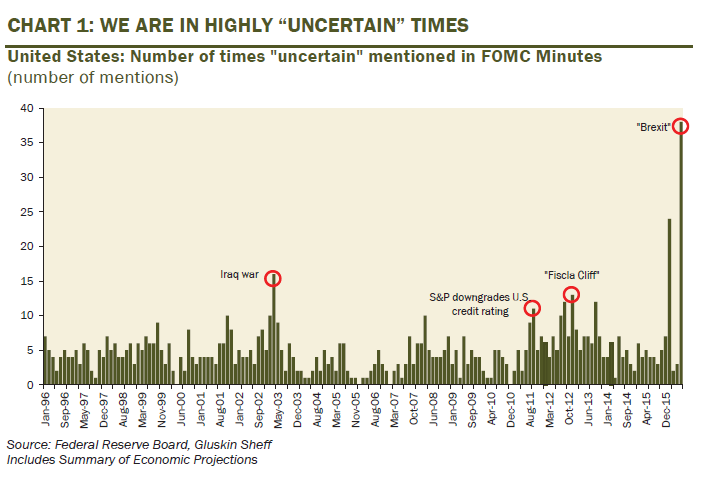
-One of Wall Street’s most strongly held beliefs is “Don’t Fight the Fed”. This means to be a buyer of stocks when it is cutting rates, or is on hold, and to sell stocks when it is tightening. However, the terrible performance of the stock market in the early 1930s, at the start of the 2000s, and from mid-2008 to early 2009—all times when the Fed was aggressively easing—calls this conviction into question. -“Don’t Fight the Spread” might be a better mantra. The episodes cited above were all times when credit spreads (the difference between government and corporate borrowing rates) were rapidly expanding. -The good news currently is that the impressive break-out to new highs by the S&P 500 has been accompanied by a further decline in credit spreads. These have been contracting since early February. As usual, this narrowing has coincided with a powerful rally in almost all markets. -The US stock market clearly has upside momentum right now and may be entering a “blow-off top” phase. However, not all indicators are supportive, particularly those of a fundamental nature, such as earnings. S&P 500 profits are back to where they were in 2006, when this index was trading at 1300, some 40% lower than today. -While Brexit turned out to be a non-event, at least from a lasting stock market standpoint, there is another risk emerging in Europe. Italy has a crucial vote coming up in October. Due to how severely the Italian economy has suffered since the euro was introduced in 1999, there is a distinct chance of the anti-European Union (EU) party winning this fall. This would likely threaten the entire EU project. -A long-running EVA prediction has been the increasing “Japanization” of the developed world. This means very slow growth combined with interest rates falling to previously unimaginable levels. 30% of global bonds, amounting to around $12 trillion, now have negative yields. The US is actually one of the last bastions of decent cash flow. Corporate America represents just 12% of total worldwide investment grade debt but is producing 33% of aggregate income. The world continues to be exceedingly growth-challenged despite (or because of) these miniscule rates. -In the US economy, some recent data has been surprisingly positive. Most notable in this regard was the June jobs number reported in early July showing an extremely healthy employment increase. However, the Household Survey (not as well known as the official Payroll Survey) showed job losses and now shows over 500,000 net terminations this year. Historically, the Household Survey has been better at picking up pivot points in the economy. -Economic releases tend to be contradictory when the economy is in transition such as from expansion to recession and vice versa. We are seeing considerable amounts of “dueling data” currently. However, when Evergreen weighs the positives and negatives, the scales seem to be leaning more toward an economy that is very late cycle.INTRODUCTION
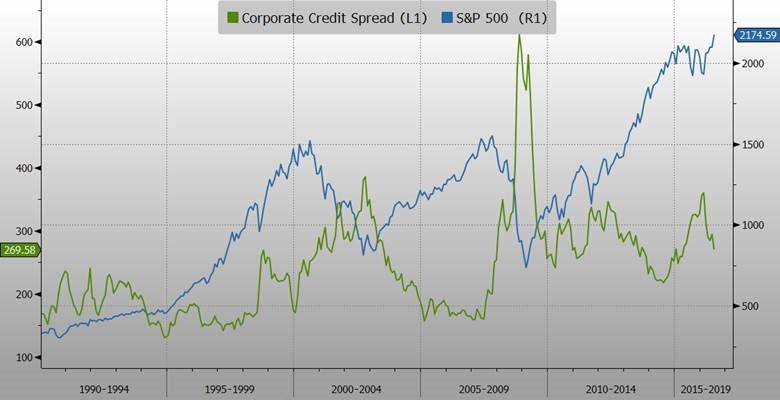
Random Thoughts. For this month’s full-length EVA, I am going to employ a different format—one we may use on a regular basis depending on reader feedback—based on the preceding title. Now, I realize that many of you think my thoughts are pretty much always random. Consequently, I should be able to pull this off without quitting my day job as Evergreen’s Chief Investment Officer. The basic idea behind this is to run a series of short commentaries—almost like vignettes—on the critical themes, memes, and, in some cases, dreams affecting the economy and financial markets (the things investors tend to care about the most). It would be most helpful to us if you could let us know what you think of this version and also which topics you care about in particular (for future coverage and analysis). With complete absence of hype, I believe this is the most extraordinary era in the history of markets. We’ve all heard that Chinese saying: “May you live in interesting times.” Well, we certainly do—with one notable exception: the disappearance of interest rates. This reality is affecting almost every critical aspect of our lives: From housing prices that are exceeding the old bubble highs of 2007, to a stock market that seems to have broken free from gravitational forces, to the inability of pension funds to earn adequate returns; to young people being forced to question how they can save for retirement. And, most ominously, for those who are retired, or close to it, and are terrified (or should be) about the prospect of funding “their golden years” when investment yields have been crushed. One could reasonably argue that national and global conditions are the most chaotic and angst-ridden since the late 1960s, another time of elevated stocks prices and low interest rates (though the latter were higher than now and definitely on the incline rather than the decline). But, as these pages have noted so often, there is always opportunity in chaos and turmoil. So, with that in mind, let’s get random.Don’t Fight the Spread. There are few Wall Street axioms that are as widely accepted as “Don’t Fight the Fed”. Thus, it’s exceedingly risky on my part to attack this bedrock belief but, as longtime readers know, often I can’t help myself. Yet, I try not to take on these convictions without having data and/or history in my corner. Before you think I’ve lost it, just consider these facts: The three worst bear markets in modern history occurred when the Fed was in frantic easing mode. The early 1930s, 2000-2002, and 2008 to early 2009, all coincided with a period of rapidly falling rates, as the Fed repeatedly cut in vain to prevent contractions in both stock prices and the economy. Stocks fell at least 50% in each of those “Big Easy” episodes. Accordingly, the core principle of “Don’t Fight the Fed”—that stock investors should align themselves with Fed policy, buying when they are easing, or at least on hold, and selling when they tighten—should be immediately called into question. Certainly, lower interest rates are generally supportive for stock prices. So, what was different about those episodes that caused the precise opposite result? We believe the facts are clear—two simple words: credit spreads, the difference between what a company like Nordstrom pays to borrow money and the rate on US government debt. Actually, Nordstrom is an ideal example because, as some veteran EVA readers recall, the interest rate on “Nordy’s” bonds rose from 6% to 13% in the fall of 2008 even as the Fed was cutting its overnight rate like Johnny Depp attacking the hedge in Edward Scissorhands. In price terms, this meant the Nordstrom bonds fell by 40%! This was no aberration. Overall, US corporate credit spreads erupted to highs unseen (not coincidentally) since the early 1930s. Consequently, even as the Fed was slashing rates, the corporate bond market was caught up in a nearly unparalleled and ferocious tightening. It’s no exaggeration to say that this moon-shot by spreads almost crashed the global financial system. Of course, it also gave cash-rich and intrepid investors the yield locking-in opportunity of a lifetime, if not several. (You can click on this link to view an EVA we wrote back then on this epic chance to nail down double-digit cash flow returns.) Unfortunately, most investors were too traumatized back then—or were too fully invested—to capitalize on this manna from the market heavens. In case you think this can’t happen again, with the Fed having effectively taken rates far below 2008 lows (through its repeated QEs that have dumped over $3 trillion into the system), last year was proof positive it can. As you are able to see in the chart below, spreads began rising in the summer of 2014 and kept soaring until February of this year. The market typically ignores the first third or so of a credit spread-widening event and this time was no exception. But as spreads kept expanding, stocks began to crack, first in August of last year when the Dow fell over 1000 points in less than an hour (even prior to the Fed hiking). Then, in January, the S&P quickly receded 15% from its high in May, 2015, with small-caps down nearly 30% (after a mere ¼% Fed rate nudge).
 Source: Evergreen Gavekal, Bloomberg
 Source: The Closing Print, Michael O’Rourke
 Source: Evergreen Gavekal, Bloomberg
 Source: Bloomberg, DoubleLine
 Source: The Leuthold Group
 Source: Ned David Research
 letter word: Italy. A major risk for that beautiful country is another five, as in the Five-Star Movement. This political party’s leaders are extremely hostile toward Brussels-based eurocrats and want out of the European Union (EU). They are currently leading in the polls and gaining momentum. There is a crucial referendum coming up in October put forth by Italy’s present prime minister, the youthful Matteo Renzi.
Most US investors seem as oblivious to this risk as they did to Brexit. One could certainly argue that since the latter only briefly hit US stocks, the potential for Italxit is non c’e problema (no problem). But we think this is dangerous thinking. Italy is the third largest economy in Europe as well as the third biggest bond market in the world (Italy isn’t that great at making cars or appliances anymore but they sure excel at producing debt!). Further, an Italxit would turn the cross-hairs on terrorism-plagued France where the anti-EU sentiment is even stronger.
It’s also well known that Italy’s banking system is a shambles with dud loans three times the level of US banks even during the worst of the Great Recession and housing implosion. Italy’s financial system desperately needs a bail-out but those pesky eurocrats are against it—supposedly. Our view is that due to how disastrous it would be to the EU if Italy says “andiamo”, Brussels will cave in and allow some type of banking rescue. Recent comments by ECB head honcho Mario Draghi are supportive of our view.
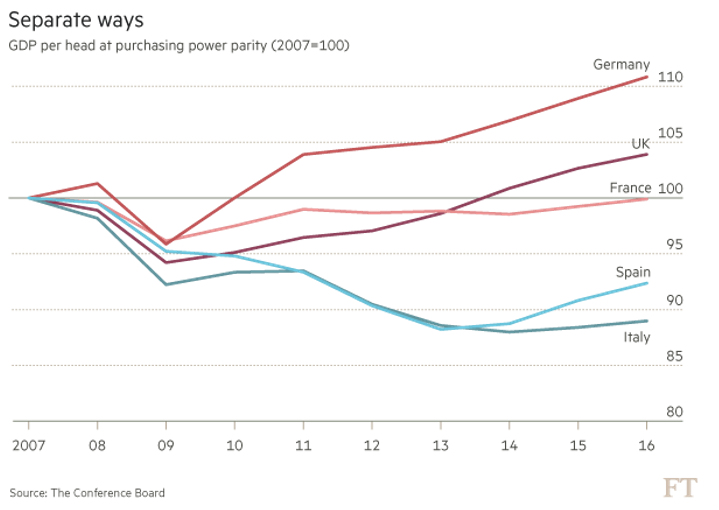
If so, this could apply another lift to the S&P. But, should a bail-out happen, we think it would be a fleeting propellant. The real problem is that the Italian economy is as bad off as its banks and there is no miracle cure for that malady. Per the following chart, Italy’s GDP has been contracting for years, underperforming even Spain where unemployment remains around 20%.
letter word: Italy. A major risk for that beautiful country is another five, as in the Five-Star Movement. This political party’s leaders are extremely hostile toward Brussels-based eurocrats and want out of the European Union (EU). They are currently leading in the polls and gaining momentum. There is a crucial referendum coming up in October put forth by Italy’s present prime minister, the youthful Matteo Renzi.
Most US investors seem as oblivious to this risk as they did to Brexit. One could certainly argue that since the latter only briefly hit US stocks, the potential for Italxit is non c’e problema (no problem). But we think this is dangerous thinking. Italy is the third largest economy in Europe as well as the third biggest bond market in the world (Italy isn’t that great at making cars or appliances anymore but they sure excel at producing debt!). Further, an Italxit would turn the cross-hairs on terrorism-plagued France where the anti-EU sentiment is even stronger.
It’s also well known that Italy’s banking system is a shambles with dud loans three times the level of US banks even during the worst of the Great Recession and housing implosion. Italy’s financial system desperately needs a bail-out but those pesky eurocrats are against it—supposedly. Our view is that due to how disastrous it would be to the EU if Italy says “andiamo”, Brussels will cave in and allow some type of banking rescue. Recent comments by ECB head honcho Mario Draghi are supportive of our view.
If so, this could apply another lift to the S&P. But, should a bail-out happen, we think it would be a fleeting propellant. The real problem is that the Italian economy is as bad off as its banks and there is no miracle cure for that malady. Per the following chart, Italy’s GDP has been contracting for years, underperforming even Spain where unemployment remains around 20%.
 Source: Financial Times, The Conference Board
 Essentially ever since its monstrous bubble in stocks and real estate explosively burst in 1990, Japan has been stuck in an economic Twilight Zone, oscillating between feeble growth and mild, but repeated, recessions with long-term growth far below the prior trend-line. This reality calls a couple of popular notions into question.
The first is that you can’t have recessions without an inverted yield curve (when short-term rates go above long-rates). As noted, Japan has had a slew of those despite its yield curve not inverting once since 1990. (By the way, the same has been true in Europe in recent years and while the US has avoided double/triple/quadruple-dip recessions, our expansion has been the weakest ever since WWII).
The other at-risk belief is that exceptionally low interest rates are enough to force stock prices higher and keep them there. Japan has had the scrawniest rates in the world for the last quarter-century and yet its stock market has been in a secular, or long-term, bear market during that entire time-frame (punctuated by numerous “counter-trend” rallies).
Essentially ever since its monstrous bubble in stocks and real estate explosively burst in 1990, Japan has been stuck in an economic Twilight Zone, oscillating between feeble growth and mild, but repeated, recessions with long-term growth far below the prior trend-line. This reality calls a couple of popular notions into question.
The first is that you can’t have recessions without an inverted yield curve (when short-term rates go above long-rates). As noted, Japan has had a slew of those despite its yield curve not inverting once since 1990. (By the way, the same has been true in Europe in recent years and while the US has avoided double/triple/quadruple-dip recessions, our expansion has been the weakest ever since WWII).
The other at-risk belief is that exceptionally low interest rates are enough to force stock prices higher and keep them there. Japan has had the scrawniest rates in the world for the last quarter-century and yet its stock market has been in a secular, or long-term, bear market during that entire time-frame (punctuated by numerous “counter-trend” rallies).
JAPANESE STOCK MARKET SINCE 1990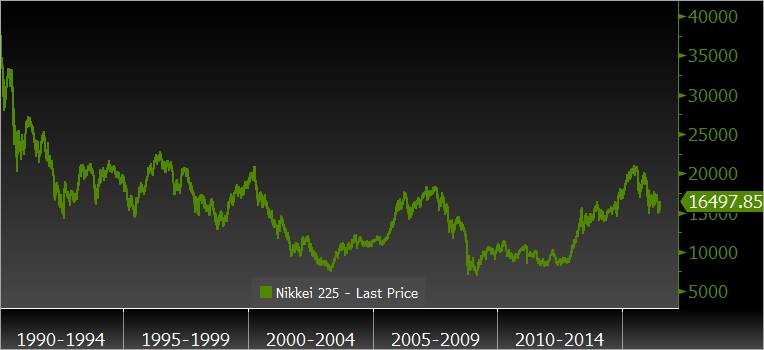 Source: Evergreen Gavekal, Bloomberg
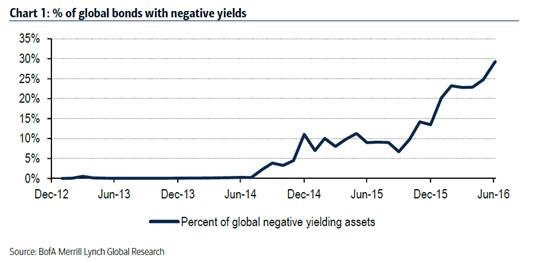 Somewhat resisting this extinction of interest rates, US bond yields, particularly in the corporate world, remain on the sunny side of zero, in many cases by a decent margin. This has created the remarkable situation where Corporate America’s investment grade debt represents just 12% of total global IOUs but a significantly disproportionate 33% of aggregate income.
Consequently, a profound question is whether the US will become more like the rest of the “rich” world or the world will become more like the US. Economic trends likely hold the answer to this query.
Fooled by recentness? Let’s cut right to the chase regarding the recent performance of the US economy: It has definitely shown signs of perking up. (If econ isn’t your game, feel free to skip this section.) The very closely followed Citigroup Economic Surprise Index has had a nice spike, as you can see in the following chart.
Somewhat resisting this extinction of interest rates, US bond yields, particularly in the corporate world, remain on the sunny side of zero, in many cases by a decent margin. This has created the remarkable situation where Corporate America’s investment grade debt represents just 12% of total global IOUs but a significantly disproportionate 33% of aggregate income.
Consequently, a profound question is whether the US will become more like the rest of the “rich” world or the world will become more like the US. Economic trends likely hold the answer to this query.
Fooled by recentness? Let’s cut right to the chase regarding the recent performance of the US economy: It has definitely shown signs of perking up. (If econ isn’t your game, feel free to skip this section.) The very closely followed Citigroup Economic Surprise Index has had a nice spike, as you can see in the following chart.
CITI ECONOMIC SURPRISE INDEX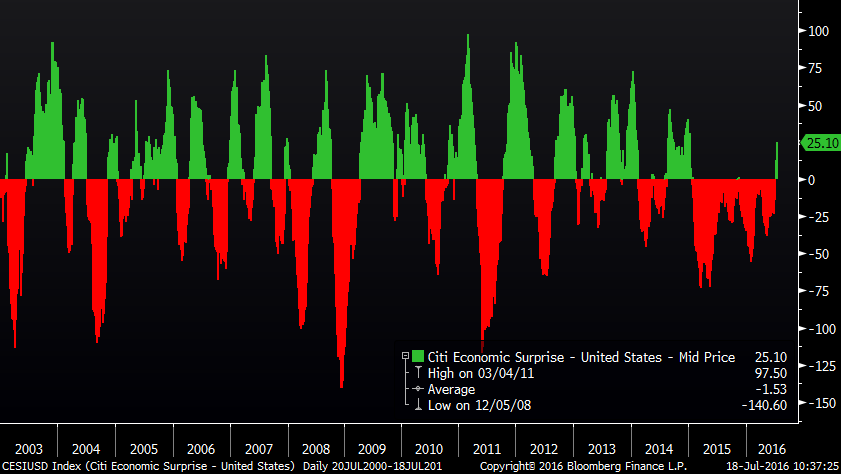 Source: Evergreen Gavekal, Bloomberg
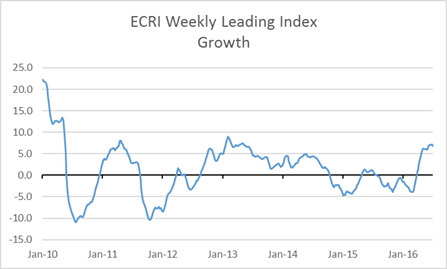
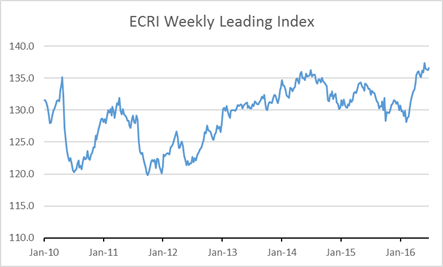 Source: Economic Cycle Research Institute
PAYROLL SURVEY—US LABOR MARKET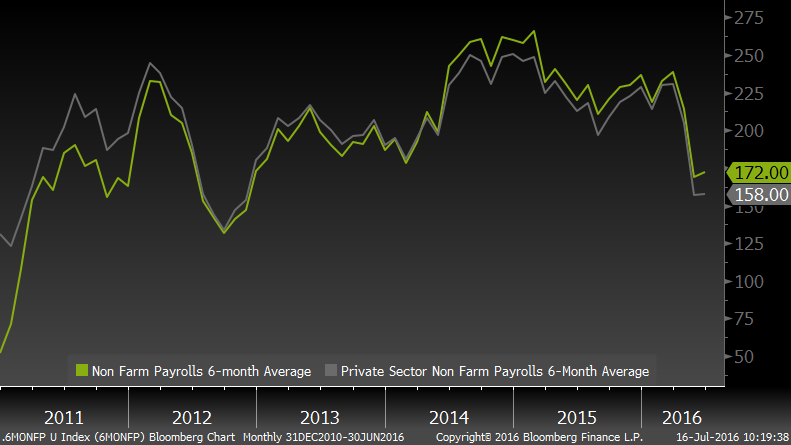 Source: Evergreen Gavekal, Bloomberg
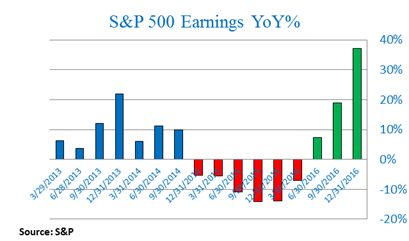
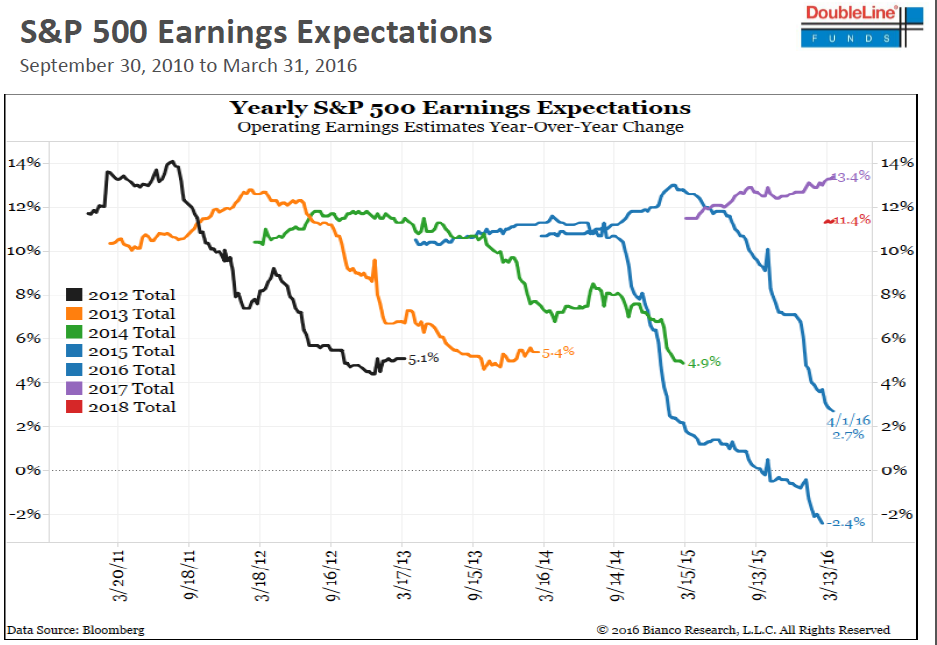
 It’s also unprecedented to have stocks valued like happy days are here again after many quarters (possibly as many as six) of falling corporate profits, per the chart at the top of page 4. Major stock market tops are always associated with peak profitability and an apex in capacity utilization. Both of those look like they are at least two years in the rear view mirror.
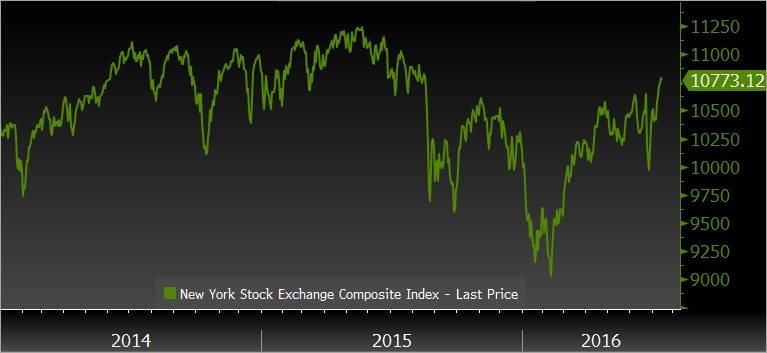
It’s additionally perplexing to me that millions of investors seem to be buying stocks for income and bonds for appreciation, the antithesis of normal behavior. They also seem to be content with a broad equity market which has essentially gone nowhere for two and a half years, with even the S&P 500 badly lagging treasury bonds since the start of the millennium, as well as from the end of 2013.
It’s also unprecedented to have stocks valued like happy days are here again after many quarters (possibly as many as six) of falling corporate profits, per the chart at the top of page 4. Major stock market tops are always associated with peak profitability and an apex in capacity utilization. Both of those look like they are at least two years in the rear view mirror.
It’s additionally perplexing to me that millions of investors seem to be buying stocks for income and bonds for appreciation, the antithesis of normal behavior. They also seem to be content with a broad equity market which has essentially gone nowhere for two and a half years, with even the S&P 500 badly lagging treasury bonds since the start of the millennium, as well as from the end of 2013.
NYSE COMPOSITE (A BROADER INDEX THAN THE S&P 500)
 Source: Evergreen Gavekal, Bloomberg
 David Hay
Chief Investment Officer
To contact Dave, email:
dhay@evergreengavekal.com
*Generally accepted account principles, i.e., real not “made as instructed” earnings.
David Hay
Chief Investment Officer
To contact Dave, email:
dhay@evergreengavekal.com
*Generally accepted account principles, i.e., real not “made as instructed” earnings.
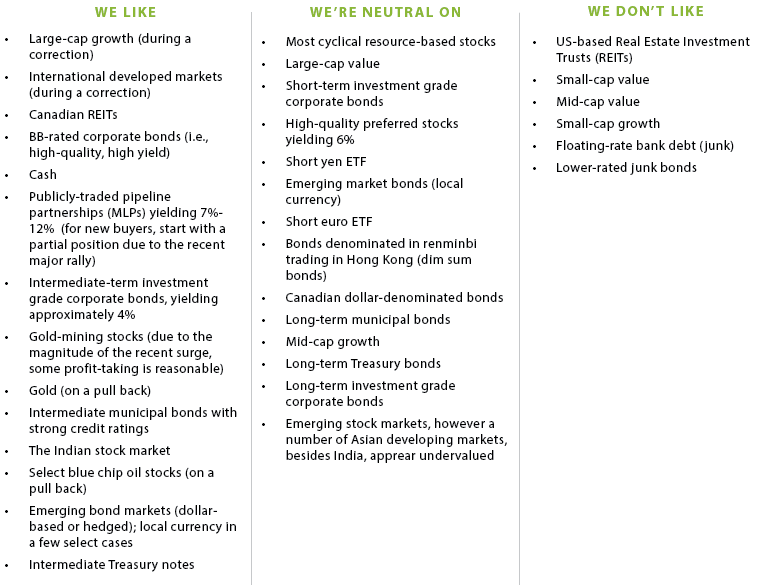
OUR CURRENT LIKES AND DISLIKES
DISCLOSURE: This material has been prepared or is distributed solely for informational purposes only and is not a solicitation or an offer to buy any security or instrument or to participate in any trading strategy. Any opinions, recommendations, and assumptions included in this presentation are based upon current market conditions, reflect our judgment as of the date of this presentation, and are subject to change. Past performance is no guarantee of future results. All investments involve risk including the loss of principal. All material presented is compiled from sources believed to be reliable, but accuracy cannot be guaranteed and Evergreen makes no representation as to its accuracy or completeness.