


Click here to view as PDF. “The ‘New Normal’ is not an environment of slower economic growth, it is one of perpetually accommodative monetary policy. To his credit, Jay Powell is trying to drain the punch bowl, but it is the size of a bathtub and he is using a straw…One thing that is longer than the longest bull market is the era of accommodative policy that fueled it.” –Jones Trading’s chief strategist MIKE O’ROURKE
Introduction
At the beginning of 2018, we initiated a new EVA series titled “Bubble 3.0” with excerpts from my upcoming book (tentatively titled “Bubble 3.0: How Central Banks Created the Next Financial Crisis”). If you are just joining us in the middle of this ongoing series, which will eventually culminate in a full-length publication (hopefully not before the expanding “Biggest Bubble Ever” or “BBE” bursts), please take a few moments to review the prior installments in the series:- Biggest Bubble Ever Quarterly Webinar (February 9th, 2018)
- Bubble 3.0: How Central Banks Created the Next Financial Crisis (April 27th, 2018)
- Bubble 3.0: How Did We Get Here? (Part I) (June 1st, 2018)
- Bubble 3.0: How Did We Get Here? (Part II) (June 8th, 2018)
- Bubble 3.0: A Fast and Furious Challenge (July 6th, 2018)
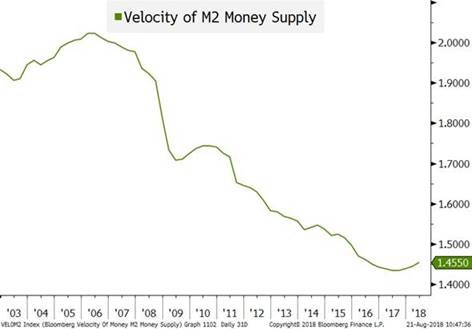
CHAPTER 4: UP FROM THE ASHES Welcome to the longest bull market in history! What a run it’s been!! Many media sources have covered this remarkable development—with some criticism of its accuracy—but what hasn’t received any attention is another possible streak. Should the S&P 500 finish the year in the black, it will be the tenth straight of positive total returns. That has never happened before in the history of this venerable index, which dates back to 1928. After so many years of relentlessly rising stock prices, it is almost impossible to recall how fear-wracked investors were a little less than a decade ago. The trauma of witnessing major financial institutions such as Fannie Mae, Freddie Mac, Lehman, and Washington Mutual collapse in the early fall of 2008—with other behemoths such as AIG and Citigroup surviving only due to massive government bail-outs (but still essentially wiping out shareholders)—was too much for many to bear (pun intended!). Just months before what would soon be known as the Global Financial Crisis, it appeared that problems in housing might merely cause a mild recession. Fed Chairman Ben Bernanke had assured the public that the melt-down in the mortgage market would stay “contained” within sub-prime loans. Other high government officials, like Treasury Secretary Hank Paulson, assured investors in Fannie and Freddie that those two “Government-Sponsored Entities”, or GSEs, were safe and sound. Within months, both Mr. Bernanke’s and Mr. Paulson’s soothing words would be proven to be utterly unsound. It was almost like what had happened in another September, seven years earlier, on 9/11/01. Americans woke up one day and the world they had known was forever changed. Fear had replaced complacency and the speed with which it happened made it feel like some kind of terrible dream. In reality, the 2008 crash was another national nightmare and one that continues to haunt us to this day, despite the seeming invincibility of the S&P 500 (at least as I write these words). After initially greatly underestimating the magnitude of the crisis, the Fed flew into action with a bold series of moves. It guaranteed money market funds which had suddenly become suspect in the minds of investors, causing a run on these widely-held vehicles that were once considered riskless. It provided enormous sums of desperately needed dollars to foreign central banks. And, perhaps most significantly, the Fed prepared to launch its first round of Quantitative Easing (QE) whereby it willed into existence $1 trillion of reserves with nothing more than a few computer keystrokes. This money-from-nothing was, of course, unprecedented. Never before had the central bank of a wealthy country resorted to such an extreme monetary policy. It was intended to instill confidence and stabilize the system, but it had an unintended consequence. Because we have become so numb to QEs over the past decade, we also forget the chorus of supposedly expert voices who warned that such overt money printing* would lead to inflation, possibly of the hyper-variety. One reason I vividly remember this aspect is that for at least the first few years after QE 1.0 was launched—with two more iterations to follow—I repeatedly found myself in the position of debating the subject with clients and other investment professionals. Many of them contended that inflation was inevitable and, moreover, that it was exactly what the US government wanted in order to inflate away its debt. (The Federal deficit was exploding in those days due to the Great Recession and the numerous bail-outs that also included GM and Chrysler). My counter-argument was that offsetting the stimulus from the trillion-dollar QE was something of which very few people were aware: the velocity of money. At the same time that the Fed was synthesizing its first trillion, money velocity was cratering at a rate unseen since the Great Depression. *In reality, QE actually was the creation of digital reserves that the Fed used to buy treasury bonds from the banking system.
 Source: Bloomberg, Evergreen Gavekal
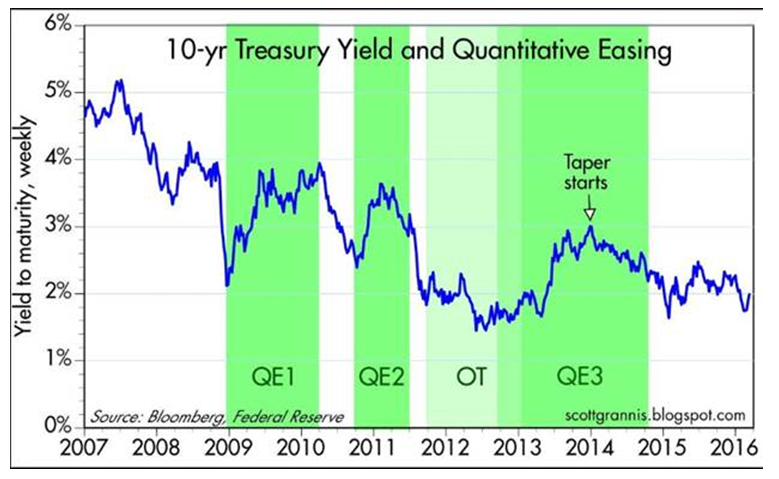 To the Fed’s great vexation, unemployment remained stubbornly high in the early years of the expansion, leading it to believe more monetary uppers were needed. In the fall of 2012, over three years into the economic up-cycle, it launched QE 3. The third iteration would turn out to be the biggest of all, eventually totaling $1.6 trillion.
By the time it finally turned off its magical money machine in October of 2014, the Fed’s balance sheet had exploded from around $700 billion pre-crisis to a stunning $4.5 trillion. Please realize this was all done with “fake money”, the aforementioned digital reserves the Fed created on its computers that it used to buy treasury bonds and government-guaranteed mortgages. There is little doubt much of this spilled over into asset prices, either directly or indirectly. (An indirect example is that by collapsing interest rates, the Fed encouraged publicly-traded companies to leverage up to buy-back their own shares, to the tune of about $5 trillion since 2010).
In addition to fabricating almost $4 trillion, it also maintained interest rates at essentially zero until meekly hiking rates in December of 2015. In other words, the Fed kept the monetary pedal to the metal over five years into the recovery cum expansion. (Technically, a recovery is the post-recession phase that returns GDP back to its prior peak and the expansion is the GDP increase that occurs thereafter.) This was totally unprecedented in the annals of Fed monetary policy.
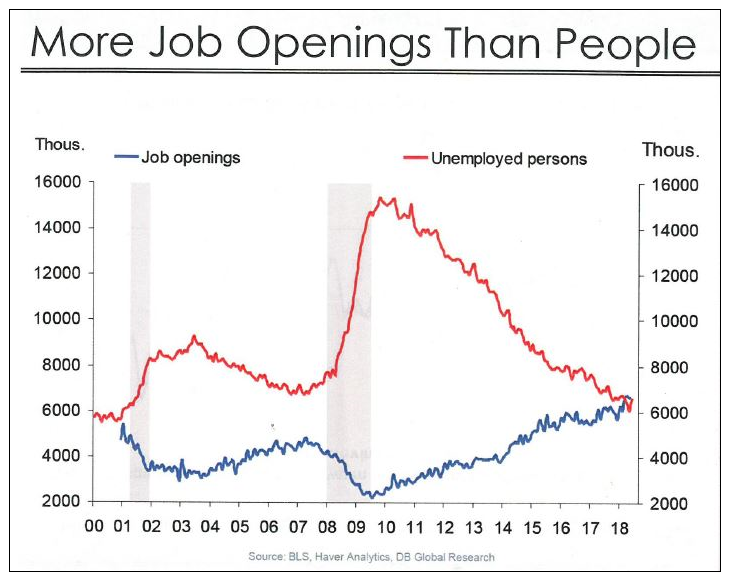
Despite this unparalleled largess, and a near doubling of the national debt (i.e., tremendous monetary and fiscal stimulus), not only was the jobless rate stubbornly high for many years, the expansion also turned out to be the weakest on record. Notwithstanding a strong second quarter of 2018, it continues to be by far the feeblest economic up-cycle in the post-WWII era. This is particularly disappointing given that the jobs market—once such an overarching concern for the Fed—is extremely strong. (By the way, historically, the worse the recession, the stronger the recovery and expansion—and those prior vigorous rebounds were achieved without multi-trillion fiscal and monetary stimulus.)
To the Fed’s great vexation, unemployment remained stubbornly high in the early years of the expansion, leading it to believe more monetary uppers were needed. In the fall of 2012, over three years into the economic up-cycle, it launched QE 3. The third iteration would turn out to be the biggest of all, eventually totaling $1.6 trillion.
By the time it finally turned off its magical money machine in October of 2014, the Fed’s balance sheet had exploded from around $700 billion pre-crisis to a stunning $4.5 trillion. Please realize this was all done with “fake money”, the aforementioned digital reserves the Fed created on its computers that it used to buy treasury bonds and government-guaranteed mortgages. There is little doubt much of this spilled over into asset prices, either directly or indirectly. (An indirect example is that by collapsing interest rates, the Fed encouraged publicly-traded companies to leverage up to buy-back their own shares, to the tune of about $5 trillion since 2010).
In addition to fabricating almost $4 trillion, it also maintained interest rates at essentially zero until meekly hiking rates in December of 2015. In other words, the Fed kept the monetary pedal to the metal over five years into the recovery cum expansion. (Technically, a recovery is the post-recession phase that returns GDP back to its prior peak and the expansion is the GDP increase that occurs thereafter.) This was totally unprecedented in the annals of Fed monetary policy.
Despite this unparalleled largess, and a near doubling of the national debt (i.e., tremendous monetary and fiscal stimulus), not only was the jobless rate stubbornly high for many years, the expansion also turned out to be the weakest on record. Notwithstanding a strong second quarter of 2018, it continues to be by far the feeblest economic up-cycle in the post-WWII era. This is particularly disappointing given that the jobs market—once such an overarching concern for the Fed—is extremely strong. (By the way, historically, the worse the recession, the stronger the recovery and expansion—and those prior vigorous rebounds were achieved without multi-trillion fiscal and monetary stimulus.)
 Source: John Mauldin, Over My Shoulder
 Source: Bloomberg, Evergreen Gavekal
 Source: Haver Analytics, Gluskin Sheff
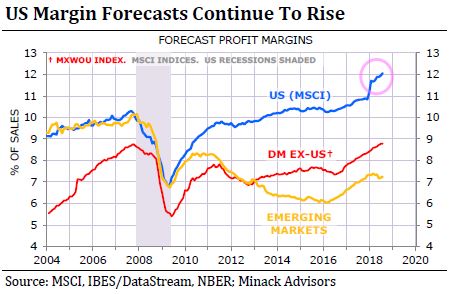
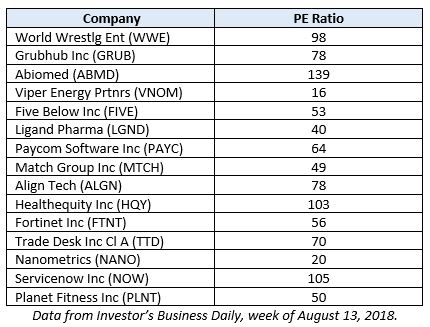 Few investors, even of the most optimistic variety, would have imagined–after witnessing the seismic financial fissures which cracked open ten years ago–that a decade later so many stocks would command such extreme valuations. But then again who would have envisioned back then that after years of economic and financial market recovery central banks would still be operating with monetary policies suited for a mega-crisis? After all, it was just last year that global quantitative easing hit its crescendo. As of now, it’s only the Fed that has begun to reverse gears and has started pulling the floodtide of liquidity out of the system (i.e., initiating the unwinding of its various QEs).
Similar to how almost everything seemed to go wrong at the same time back in 2008, during this incessant rise out of the post-crash rubble almost everything has broken to the good. When it looked like Europe was imploding in 2012, European Central Bank (ECB) head Mario Draghi promised to do whatever it took to prevent a euro collapse. Whenever earnings faltered, the ECB and other central banks have ridden to the rescue. When it appeared that the lift from money-for-nothing (or less than) was losing its anti-gravity effects, Donald Trump’s election provided the next booster stage. As the confidence surge from his win began to ebb, the massive corporate tax cut was passed just in the nick of time.
It’s been truly a remarkable decade, with a script no one could have credibly created 10 years ago. I’m not aware of any prophet of doom who foresaw how terrible things would become back in August of 2008. Nor do I recall any starry-eyed optimist who foresaw how long and powerful the US stock market recovery would be once it hit bottom, a rally that has left the once-idolized overseas markets in its dust. Remarkably, this has all happened despite the limp and heavily stimulus-reliant economic expansion.
It also occurred notwithstanding intense skepticism among the investor class toward Barrack Obama who was inaugurated mere weeks before the stock market bottomed. You could have received huge odds in early 2009 betting that the S&P 500 would post positive returns for eight straight years with Mr. Obama in the White House. And yet that’s exactly what happened with another year and two-thirds under Mr. Trump, even though his economic policies have been radically different.
If you are looking for the common thread between the Obama and Trump stock market rallies, you may not need to look much further than share buy-backs. That’s been the one main constant. The good news for bulls is that they are running at their hottest pace yet, with no sign of cooling. The bad news is that at some point they will drop off, probably dramatically. When they do, there will remain trillions of dollars of debt incurred, along with all of the interest required to service the additional IOUs.
Unfortunately, what gets scant press—for now—is how much of the share repurchasing has been offset by management stock options. In the next bear market, the trillions of high-priced buy-backs may not be viewed quite so favorably by bag-holding investors.
But, regardless, this has been one rollicking bull market in almost everything. Central bankers of the world, unite—and take a big bow. But remember that even you and your mighty printing presses can only delay market cyclicality, not eliminate it.
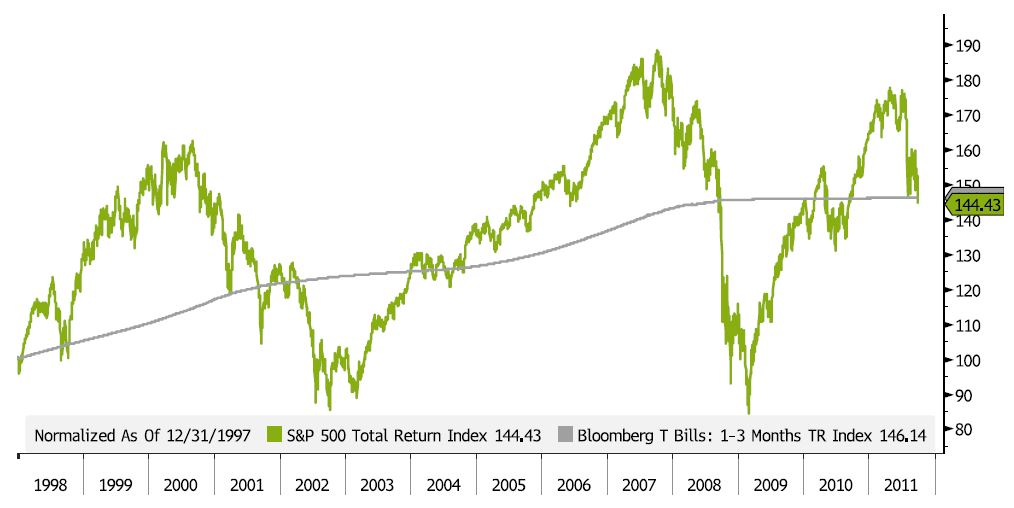
Before they can declare they’ve won the war, and not just a battle, the next market down-turn better not look like the last two. For those that think I’m blowing smoke, consider the impact the last two market down cycles have had on very long-term investment returns. Because of how expensive stocks became in the late 1990s, and again in 2007, when the prior two bear markets hit, it meant that for 14 years—from the end of 1997 until nearly the end of 2011—the S&P 500 actually underperformed T-bills!!
Few investors, even of the most optimistic variety, would have imagined–after witnessing the seismic financial fissures which cracked open ten years ago–that a decade later so many stocks would command such extreme valuations. But then again who would have envisioned back then that after years of economic and financial market recovery central banks would still be operating with monetary policies suited for a mega-crisis? After all, it was just last year that global quantitative easing hit its crescendo. As of now, it’s only the Fed that has begun to reverse gears and has started pulling the floodtide of liquidity out of the system (i.e., initiating the unwinding of its various QEs).
Similar to how almost everything seemed to go wrong at the same time back in 2008, during this incessant rise out of the post-crash rubble almost everything has broken to the good. When it looked like Europe was imploding in 2012, European Central Bank (ECB) head Mario Draghi promised to do whatever it took to prevent a euro collapse. Whenever earnings faltered, the ECB and other central banks have ridden to the rescue. When it appeared that the lift from money-for-nothing (or less than) was losing its anti-gravity effects, Donald Trump’s election provided the next booster stage. As the confidence surge from his win began to ebb, the massive corporate tax cut was passed just in the nick of time.
It’s been truly a remarkable decade, with a script no one could have credibly created 10 years ago. I’m not aware of any prophet of doom who foresaw how terrible things would become back in August of 2008. Nor do I recall any starry-eyed optimist who foresaw how long and powerful the US stock market recovery would be once it hit bottom, a rally that has left the once-idolized overseas markets in its dust. Remarkably, this has all happened despite the limp and heavily stimulus-reliant economic expansion.
It also occurred notwithstanding intense skepticism among the investor class toward Barrack Obama who was inaugurated mere weeks before the stock market bottomed. You could have received huge odds in early 2009 betting that the S&P 500 would post positive returns for eight straight years with Mr. Obama in the White House. And yet that’s exactly what happened with another year and two-thirds under Mr. Trump, even though his economic policies have been radically different.
If you are looking for the common thread between the Obama and Trump stock market rallies, you may not need to look much further than share buy-backs. That’s been the one main constant. The good news for bulls is that they are running at their hottest pace yet, with no sign of cooling. The bad news is that at some point they will drop off, probably dramatically. When they do, there will remain trillions of dollars of debt incurred, along with all of the interest required to service the additional IOUs.
Unfortunately, what gets scant press—for now—is how much of the share repurchasing has been offset by management stock options. In the next bear market, the trillions of high-priced buy-backs may not be viewed quite so favorably by bag-holding investors.
But, regardless, this has been one rollicking bull market in almost everything. Central bankers of the world, unite—and take a big bow. But remember that even you and your mighty printing presses can only delay market cyclicality, not eliminate it.
Before they can declare they’ve won the war, and not just a battle, the next market down-turn better not look like the last two. For those that think I’m blowing smoke, consider the impact the last two market down cycles have had on very long-term investment returns. Because of how expensive stocks became in the late 1990s, and again in 2007, when the prior two bear markets hit, it meant that for 14 years—from the end of 1997 until nearly the end of 2011—the S&P 500 actually underperformed T-bills!!
S&P RETURNS VS. T-BILLS, 1998-2011
 Source: Bloomberg, Evergreen Gavekal


OUR CURRENT LIKES AND DISLIKES
Changes highlighted in bold.
LIKE- Large-cap growth (during a correction)
- Some international developed markets
- Cash
- Publicly-traded pipeline partnerships (MLPs) yielding 6%-12% (buy carefully after the recent rally; long-term, however, future returns look highly attractive)
- Gold-mining stocks
- Gold
- Select blue chip oil stocks
- Mexican stocks
- Investment-grade floating rate corporate bonds
- One- to two-year Treasury notes
- Canadian dollar-denominated short-term bonds
- Select European banks
- Short-term investment grade corporate bonds (1-2 year maturities)
- Emerging market bonds in local currency (start a dollar-cost-averaging process and be prepared to buy more on further weakness)
- Most cyclical resource-based stocks
- Mid-cap growth
- Emerging stock markets; however, a number of Asian developing markets appear undervalued
- Solar Yield Cos
- Large-cap value
- Canadian REITs
- Intermediate-term investment-grade corporate bonds, yielding approximately 4%
- Intermediate municipal bonds with strong credit ratings
- US-based Real Estate Investment Trusts (REITs)
- Long-term Treasury bonds
- Long-term investment grade corporate bonds
- Intermediate-term Treasury bonds
- Long-term municipal bonds
- Short euro ETF
- Small-cap value
- Mid-cap value
- Small-cap growth
- Lower-rated junk bonds
- Floating-rate bank debt (junk)
- US industrial machinery stocks (such as one that runs like a certain forest animal, and another famous for its yellow-colored equipment)
- Preferred stocks
- BB-rated corporate bonds (i.e., high-quality, high yield; in addition to rising rates, credit spreads look to be widening) * **
- Short yen ETF
- Dim sum bond ETFs; individual issues, such as blue-chip multi-nationals, are attractive if your broker/custodian is able to buy them