


“The tour we’ve taken through the last century proves that market irrationality of an extreme kind periodically erupts — and compellingly suggests that investors wanting to do well had better learn how to deal with the next outbreak.” – Warren Buffett
Introduction
If you’ve been a frequent reader of these pages since 2018, you’re likely well-aware of our propensity to write about “bubbles.” In fact, over the last 2 ½ years, we penned twenty-five installments in our series on “Bubble 3.0”. Without rehashing our thesis in too much detail, our basic argument was (and is) that central bank policies have been the main driver of inflated asset prices over the past ten years. As the decade-old equity bubble burst in March due to the Covid-19 pandemic, we wrapped up our long-running series (which is currently being combined into a full-length book). However, the conclusion of the series might have been a tad premature because, after an unprecedented sell-off, stocks rebounded in a major way over a very short period of time. You probably guessed it, but the Fed was once again the major catalyst for equities – with a very strong assist to Congress. “Big tech” has been front-and-center in the resurgence, as mega-cap tech stocks have flourished to market valuations that were considered outlandish in the not-too-distant past. Which begs the question: are tech stocks the next big bubble? As we outlined in our missive last week, running alongside the thundering herd can be incredibly alluring, but as history has shown time-and-time again, those that jump in at the end of the pack tend to get trampled when the herd suddenly changes direction. And if the latest Google search trends for “tech stocks” are any indication, the herd is running at a parabolic pace towards a very small subset of historically expensive stocks.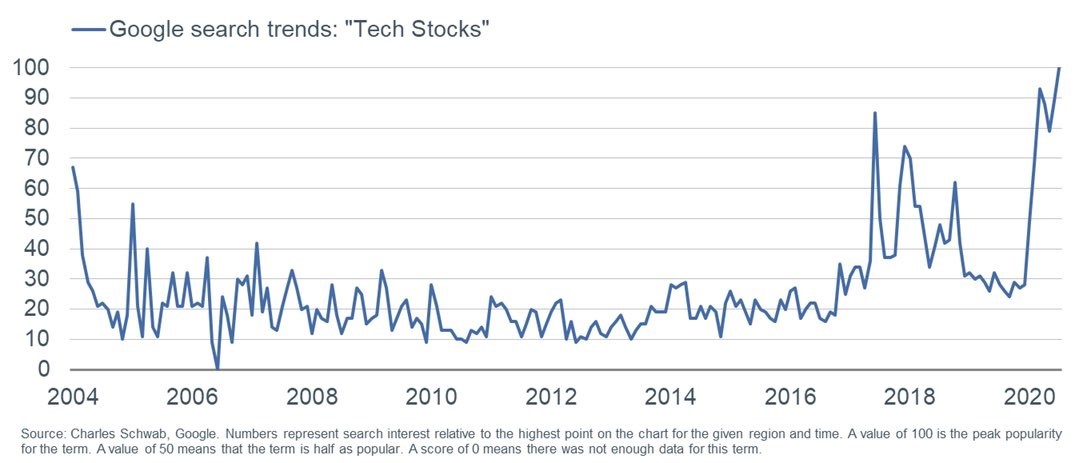 This week, we are presenting the second installment in a three-part series from Evergreen Gavekal’s partner, Louis-Vincent Gave, on the question of whether equities in general – and mega-cap tech stocks specifically – have returned to bubble territory. The installment is part of a broader quest to make sense of the exceptional performance of equity markets in the second quarter of this year, despite a still-struggling economy, a raging public health crisis, increased political tension, and an uncertain future. (Click here for Louis’ first missive.) Next week, we will present the final installment in the series, where Louis examines whether the ferocious rally in tech, along with precious metals, has been fueled by the realization that the once-mighty US dollar is destined to become worthless…or, at least, worth a lot less. But more on that next week…
Disclosure: Louis Gave has an equity ownership in Evergreen. Louis’ views and opinions are his own, and are not necessarily the views of Evergreen. Securities highlighted or discussed in this communication are not a recommendation for or against these securities. Evergreen actively manages client portfolios and securities discussed in this communication may or may not be held in such portfolios at any given time. Please see important disclosures following this piece.
This week, we are presenting the second installment in a three-part series from Evergreen Gavekal’s partner, Louis-Vincent Gave, on the question of whether equities in general – and mega-cap tech stocks specifically – have returned to bubble territory. The installment is part of a broader quest to make sense of the exceptional performance of equity markets in the second quarter of this year, despite a still-struggling economy, a raging public health crisis, increased political tension, and an uncertain future. (Click here for Louis’ first missive.) Next week, we will present the final installment in the series, where Louis examines whether the ferocious rally in tech, along with precious metals, has been fueled by the realization that the once-mighty US dollar is destined to become worthless…or, at least, worth a lot less. But more on that next week…
Disclosure: Louis Gave has an equity ownership in Evergreen. Louis’ views and opinions are his own, and are not necessarily the views of Evergreen. Securities highlighted or discussed in this communication are not a recommendation for or against these securities. Evergreen actively manages client portfolios and securities discussed in this communication may or may not be held in such portfolios at any given time. Please see important disclosures following this piece.
Have Equities Become a Bubble? by Louis-Vincent Gave
Charles [Gave] never tires of reminding us that “reading the financial press is bad for your financial health.” Underpinning his belief isn’t just the old adage that “if it’s in the press, it’s in the price,” but also the reality that financial journalists are quick to declare any rising market, a “bubble.” The definition of a bubble is a period marked by asset prices that have climbed far above historical valuations, and far above the projected earnings capacity of the underlying assets. Of course, the line between a “bull market” and a “bubble” can be blurry even at the best of times—when the visibility of future earnings and the direction of future interest rates is clear enough. And today is far from the best of times. As we enter unchartered territory for fiscal policy, unchartered territory for monetary policy, and unchartered territory for economic collapse, figuring out where “the blurry line” lies has never been more challenging. In a world in which the Ayn Rand Institute can apply for a Paycheck Protection Loan from the US government with no thought of public embarrassment, anything becomes possible. This brings me back to the point I made two weeks ago in the first paper of this series: contemplating the exceptional performance of equity markets in the second quarter of this year, investors can come to one of three possible conclusions:- Equity investors are increasingly pricing in a return to the kind of investment environment that prevailed before the crisis, even though underlying macro conditions and policies have shifted dramatically.
- Equity investors have taken leave of their senses.
- Investors are increasingly coming to the realization that the cash in their bank accounts is destined to become worthless.
- Misjudged the degree to which an asset will generate cash flows in the future, whether that asset is a railway, radio, broadband, Japanese land, or Florida and Arizona real estate.
- Misjudged the scarcity of an asset, whether tulips, gold, or energy.
- A bubble in a scarcity asset, funded by central banks. Bubbles in scarcity assets are a problem; once they implode, the economy is left with just as much land or gold or tulips as it started with. No new wealth has been created.
- A bubble in a scarcity asset, funded by commercial banks. This is by far the worst sort of possible bubble. On the way up, no new productive capacity gets created, and on the way down banks are left to lick their wounds and are incapable of participating in the next phase of growth in the underlying economy.
- A bubble in productive assets, funded by central banks. This is the best sort of bubble; once it implodes, it simply takes an adjustment in the prices of assets to allow their transfer from “weak hands” to “strong hands.” One way to facilitate this transfer is through a large currency devaluation, which attracts strong hands from abroad.
- A bubble in productive assets, funded by commercial banks. This is less than ideal, but the hangover can be dealt with through a nationalization of the banking system.
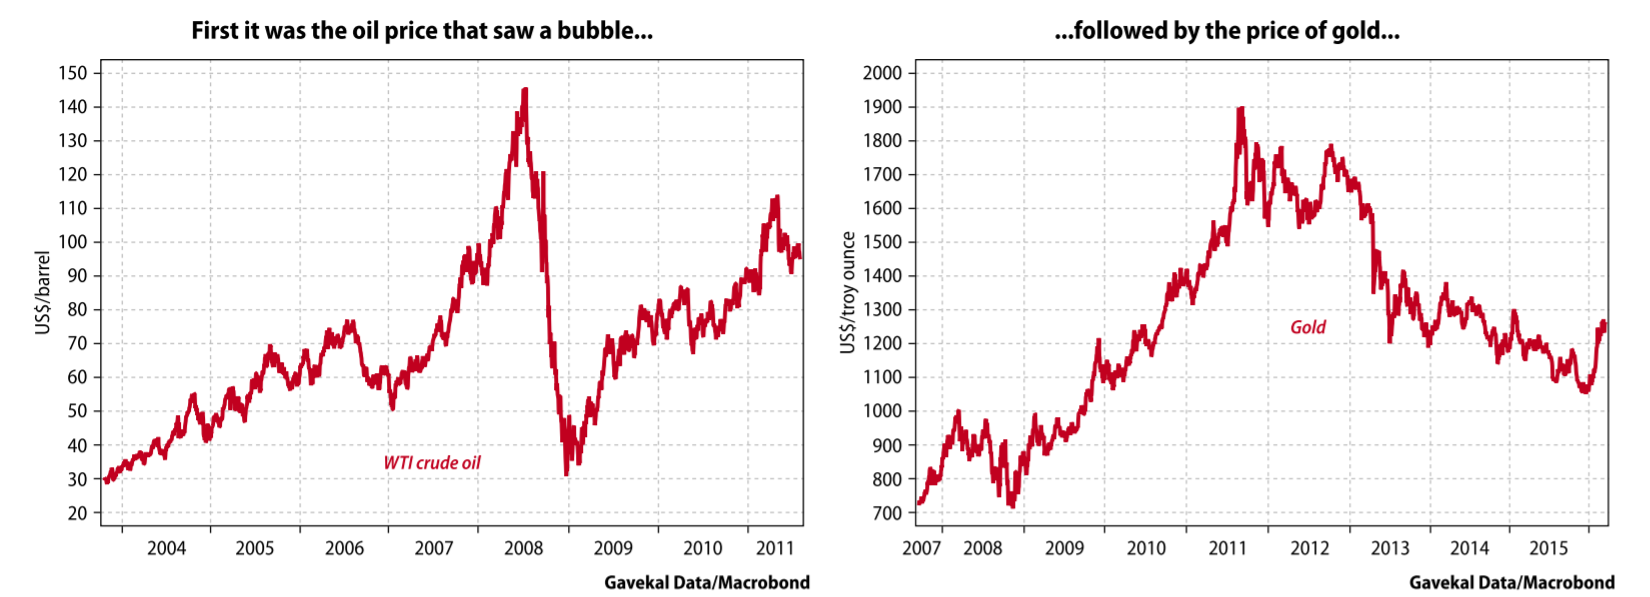
- In 2008, the market saw an exponential rise in the price of oil (and to a lesser extent in the prices of thermal coal and natural gas) on the mistaken belief that the world was facing a “peak oil” turning point beyond which the exhaustion of the world’s crude reserves would dictate ever-diminishing production. This triggered a surge of capital misallocation into the energy sector.
- Between 2009 and 2011, there was a surge in the price of gold on the mistaken belief that the US Federal Reserve’s first and second rounds of quantitative easing would trigger hyper-inflation.
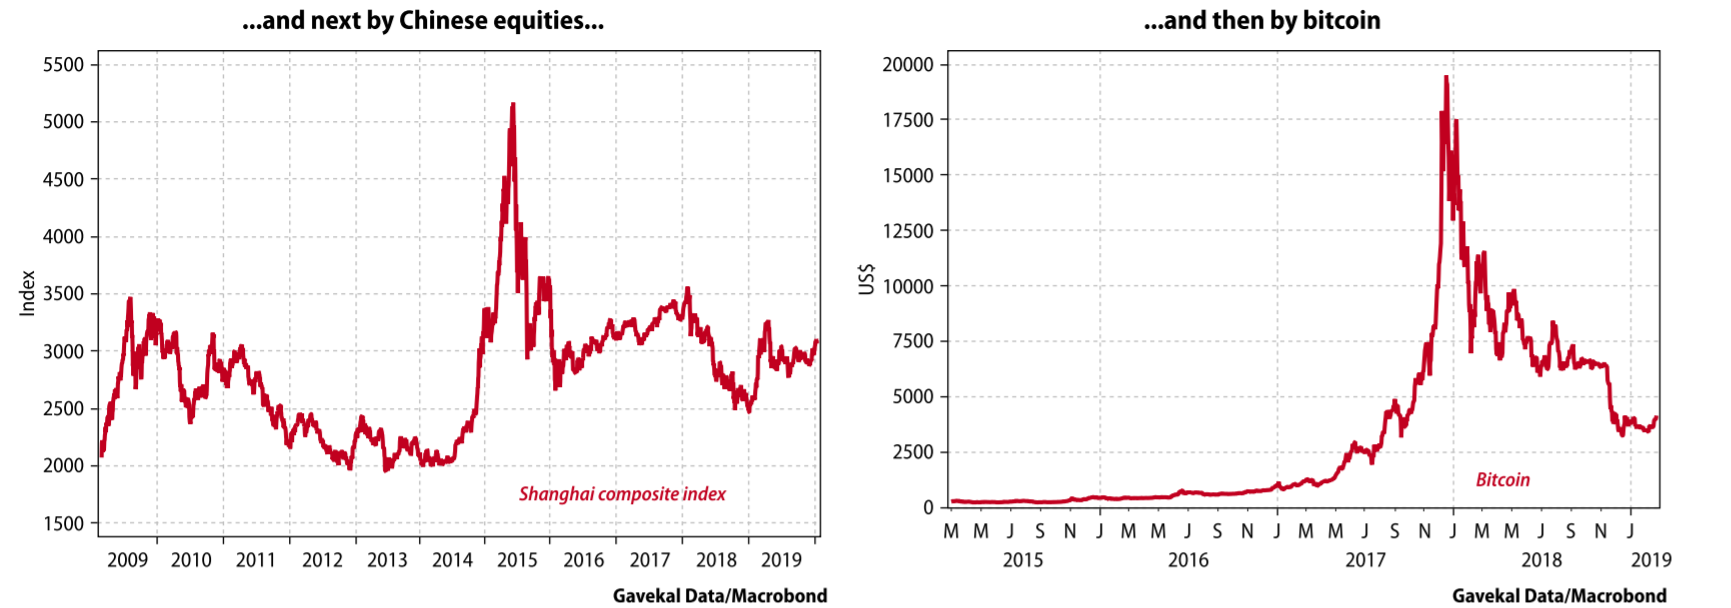
- Between late-2014 and mid-2015, China’s equity markets saw a melt-up of the sort seldom witnessed anywhere, with the Shanghai composite index doubling in six months. This surge wrong-footed a large cohort of China bears, who had been busy warning that massive capital misallocation following China’s 2008 stimulus and the construction around the country of “ghost cities” would precipitate a financial crisis.
- In 2017, Bitcoin and a flood of more or less credible new “coins” grabbed the headlines as crypto-currency prices went crazy.
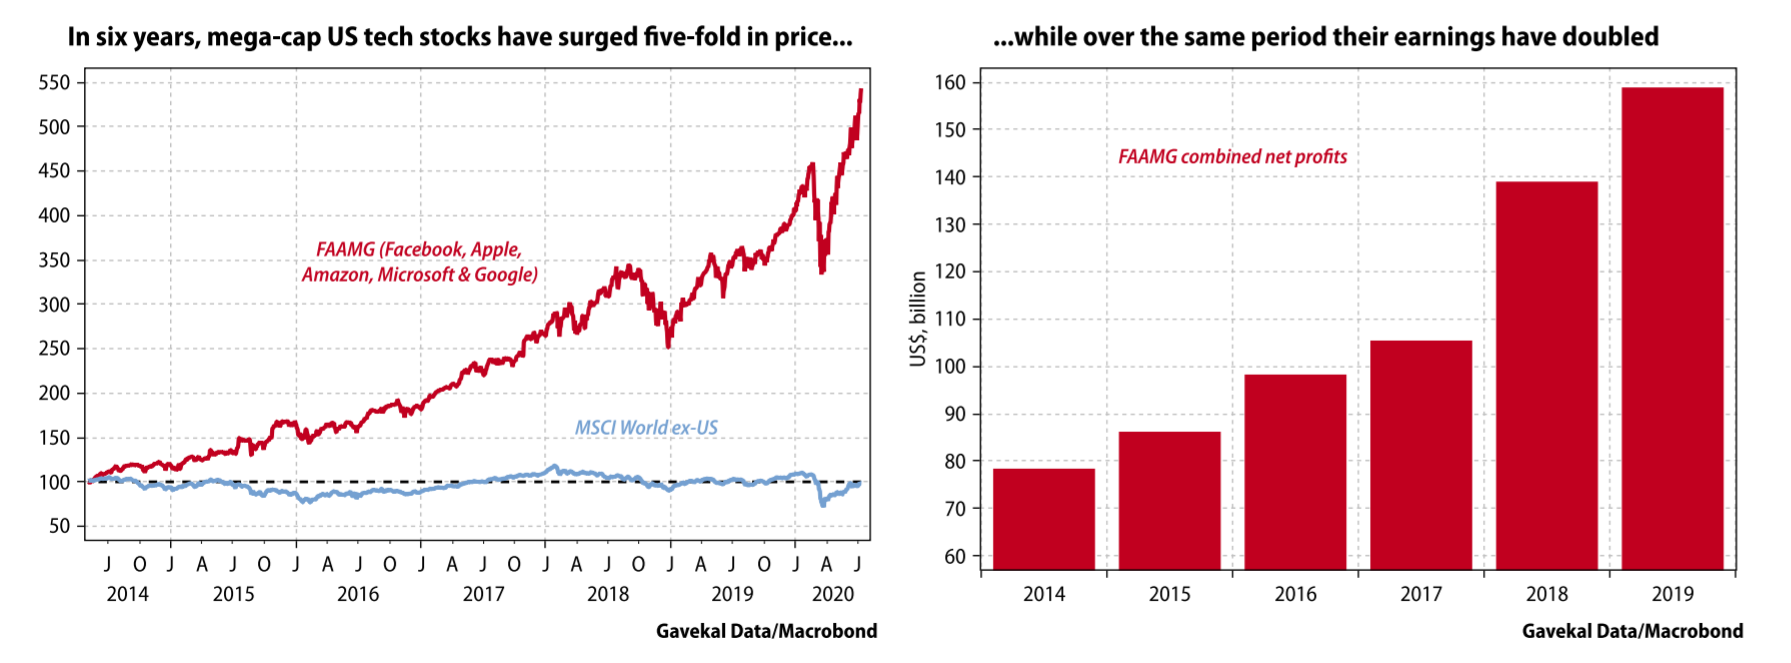
 Today, capital is flooding into a handful of mega-cap US tech stocks. In fact, as the left hand chart below shows, the top five companies in the world by market cap today have risen five-fold over the past six years, while over the same period the MSCI World ex-US index has flat-lined. Given the picture shown by this chart, it is hard to argue that equity markets as a whole are in bubble territory. If the MSCI World ex-US index has spent the past six years going essentially nowhere, it falls at the first hurdle of a bubble’s definition—that asset prices have risen so far they have lost all relation to the underlying reality. If there is a bubble in global equity markets today, then the bubble is squarely in “big tech”. The question today is therefore not whether global equity markets are in a bubble (they are not), but whether the people who are investing in big tech have taken leave of their senses.
 Is Big Tech in a bubble? And if it is, what kind of bubble is it?
Perhaps the simplest way to answer the first of these questions is to look at the phenomenal rise in big tech’s share prices over the last few years, and compare this performance to big tech’s earnings. Between 2014 and 2019, the combined after-tax profits of Facebook, Apple, Amazon, Microsoft and Google grew from US$78.4bn to US$158.9bn. That’s slightly more than double, or a compound annual growth rate of roughly 15%.
That’s nothing to sneer at, of course. Growing profits by 15% a year over a period when global growth was just a fraction of that is impressive. But it is not nearly as impressive as the share price performance of the same five companies’ stocks. Between the beginning of 2014 and the end of 2019, FAAMG share prices rose by 26% a year. So, the US$80bn increase in profits delivered by FAAMG unleashed a US$3trn increase in FAAMG market cap— and a US$4.4trn increase if you take today’s market cap. That’s quite a bang for the buck!
So yes, we can say FAAMG are in a bubble. But going back to our initial distinction, is it an “efficiency” bubble or a “scarcity” bubble?
Efficiency bubble or scarcity bubble?
It seems clear that the past decade’s sharp rises in energy, gold and bitcoin were driven by the “scarcity” belief. Not only that, but the 2015 China A-share melt-up was also a scarcity bubble, as it was driven in large part by the hope that China’s inclusion in the MSCI emerging markets index would set off a massive rush among foreign investors for exposure to Chinese assets—and that there simply wouldn’t be enough A-shares to go round.
But what about today’s widening gap between the share price performance and market cap of big tech on one hand, and the ability of the underlying companies to deliver ever-greater profits on the other? Fundamentally, there are two possible explanations of this divergence:
Is Big Tech in a bubble? And if it is, what kind of bubble is it?
Perhaps the simplest way to answer the first of these questions is to look at the phenomenal rise in big tech’s share prices over the last few years, and compare this performance to big tech’s earnings. Between 2014 and 2019, the combined after-tax profits of Facebook, Apple, Amazon, Microsoft and Google grew from US$78.4bn to US$158.9bn. That’s slightly more than double, or a compound annual growth rate of roughly 15%.
That’s nothing to sneer at, of course. Growing profits by 15% a year over a period when global growth was just a fraction of that is impressive. But it is not nearly as impressive as the share price performance of the same five companies’ stocks. Between the beginning of 2014 and the end of 2019, FAAMG share prices rose by 26% a year. So, the US$80bn increase in profits delivered by FAAMG unleashed a US$3trn increase in FAAMG market cap— and a US$4.4trn increase if you take today’s market cap. That’s quite a bang for the buck!
So yes, we can say FAAMG are in a bubble. But going back to our initial distinction, is it an “efficiency” bubble or a “scarcity” bubble?
Efficiency bubble or scarcity bubble?
It seems clear that the past decade’s sharp rises in energy, gold and bitcoin were driven by the “scarcity” belief. Not only that, but the 2015 China A-share melt-up was also a scarcity bubble, as it was driven in large part by the hope that China’s inclusion in the MSCI emerging markets index would set off a massive rush among foreign investors for exposure to Chinese assets—and that there simply wouldn’t be enough A-shares to go round.
But what about today’s widening gap between the share price performance and market cap of big tech on one hand, and the ability of the underlying companies to deliver ever-greater profits on the other? Fundamentally, there are two possible explanations of this divergence:
- The market is anticipating an impressive acceleration in profits from here on for the FAAMG group of companies.
- The market, in its collective wisdom, has decided to place a “scarcity premium” on the value of big tech companies.
- Given the Covid uncertainty, who knows what Apple, Facebook or Google’s sales or profits will look like looking forward?
- The law of large numbers means that for most of the tech behemoths growing earnings will become ever more challenging.
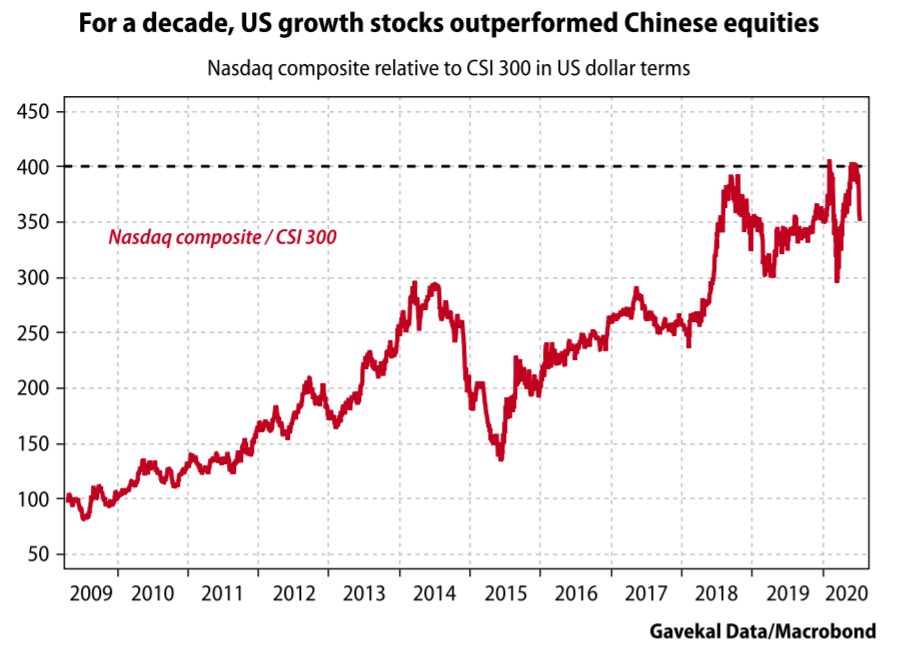
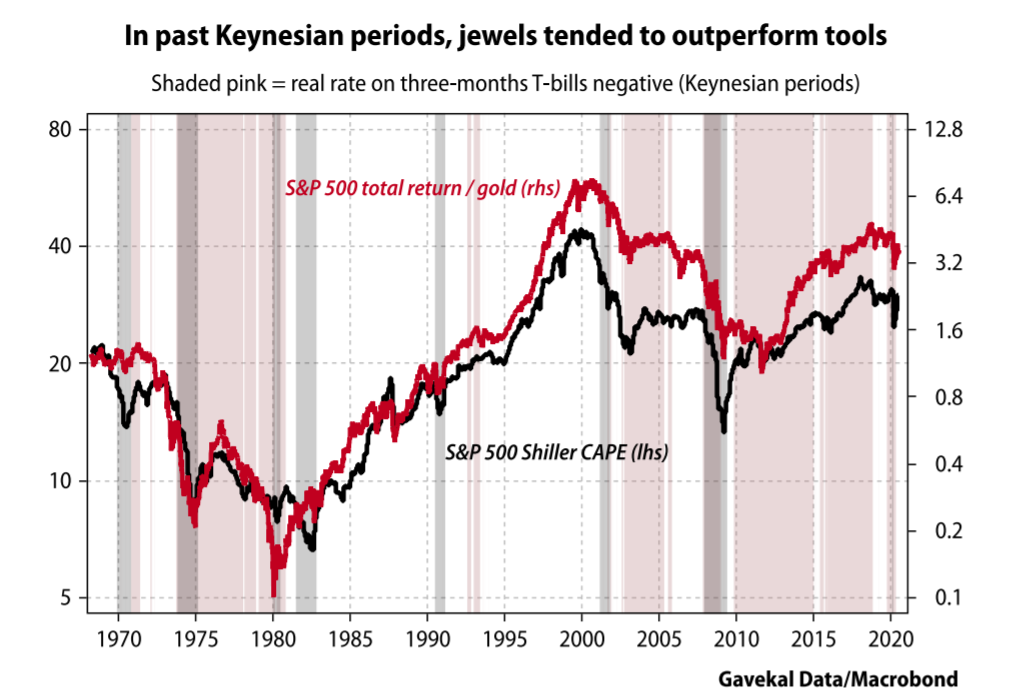 But “worked” in the past tense appears to be the correct word here. For much of the last decade, and doubly so today, the Fed has been pursuing an aggressive Keynesian policy. However, over the same period, US equities, and especially US growth stocks, considered the most efficient part of the efficiency basket, have significantly outperformed gold, the ultimate jewel or scarcity asset.
So why has the rule stopped working? Here is a suggestion: in recent years, there has occurred an historically unusual reversal of perceptions among investors about what is scarce and what is abundant.
But “worked” in the past tense appears to be the correct word here. For much of the last decade, and doubly so today, the Fed has been pursuing an aggressive Keynesian policy. However, over the same period, US equities, and especially US growth stocks, considered the most efficient part of the efficiency basket, have significantly outperformed gold, the ultimate jewel or scarcity asset.
So why has the rule stopped working? Here is a suggestion: in recent years, there has occurred an historically unusual reversal of perceptions among investors about what is scarce and what is abundant.
- Oil, which just a few years ago was thought scarce, is now considered plentiful. This matters because the cost of other commodities is determined largely by the oil price—food takes a lot of energy to produce, gold takes energy to mine and so on. So, in a world in which energy is abundant, most other commodities will also lose their scarcity premiums.
- Technology has now come to be considered the ultimate scarcity asset. If a company is the dominant force in any given tech field, investors conclude that it has the opportunity to cash in on massive monopoly rents and generate certain and steady increases in profits. This monopoly position, and its outsized rents, can then be projected far into the future.
- A shift in the macro environment. Scarcity assets thrive in Keynesian times, and struggle in Wicksellian times. So, if and when the Fed starts to shift away from its current aggressively Keynesian stance, the nifty five could come under pressure. Today, this seems a very low probability risk.
- Markets stop seeing the nifty five as scarcity assets because governments start to attack their monopolies, perhaps even forcing breakups. A few months ago, the breakup of big tech seemed as if it could become a theme in the US presidential election. Since then, events have taken over, and tech regulation has slipped a long way down the US political playlist. In Europe, however, a digital tax still appears likely, along with a renewed focus on the business practices of at least some of the nifty five. This risk may be small, but it is far from negligible.
- Another scarcity asset starts to shoot up, robbing the nifty five of their perceived status as the scarcity asset of choice. This is what happened in 1973, when the surge in oil prices pulled the rug from under the feet of the original nifty fifty. Could the same happen today? The US twin deficits are much bigger than in the early 1970s, the pull-back in oil production is very real, and oil prices are creeping higher again, even while demand remains deeply depressed. In short, this seems a possible risk. Hedging tech positions with out-of-the-money calls on energy, or by owning energy producers, makes sense.
- The nifty five turn out to be neither very nifty, nor that scarce. Part of the logic of paying up for the likes of Microsoft, Amazon or Apple is that these companies have repeatedly demonstrated their ability to grow sales, or at least to grow earnings per share (sometimes by gearing up and buying back shares), almost regardless of the economic environment. As a result, the scarcity value of the nifty five would clearly be threatened if the market were to begin to question this ability. This could happen if sales and profits disappoint a lot more than the market expects. Or it could happen because a return to pre-1982-style regulations prohibits share buybacks. Of the four threats, this one appears the most immediate.
- Big tech. The current market darling, big tech is loved by investors for its perceived ability to deliver growth almost regardless of underlying economic conditions. Today, big tech is displaying a number of bubble attributes, including growing divergence between share price performance and earnings, parabolic share price appreciation, and increased retail participation. Most importantly, it is priced as a scarcity asset, when historically tech has been anything but scarce.
- Covid victims, including airlines, cruise lines, restaurants, hotels, car rental companies and casinos. Some of these may never have been great businesses to begin with. Airlines and cruise lines have always tended to be fairly cyclical businesses, with a high capital intensity and more often than not the need to run at high capacity to generate profits. Yet somehow retail investors have flocked to this segment of the market like moths to a flame. Examples abound, including the sale of shares by Hertz and the growth in assets under management of JETS—the airline ETF—from US$50mn at the start of the year to US$1.5bn today. In the last few weeks, the wind seems to have gone out of the Covid victims’ sails. That may be because the Covid news around the world has been discouraging, or it may be because these businesses were not that inspiring to begin with.
- Bond proxies, including consumer staples, big pharma and utilities. These stocks have also gone nowhere in recent weeks. That could be because they are unexciting, or it could be because bond yields are no longer falling, and the US dollar has stopped rising.
- Cyclicals, financials and emerging markets. This is the part of the market that will thrive if the prevailing investment environment over much of the last decade—a strong US dollar, weak global growth and weak inflation—starts to change.
 DISCLOSURE: This material has been prepared or is distributed solely for informational purposes only and is not a solicitation or an offer to buy any security or instrument or to participate in any trading strategy. Any opinions, recommendations, and assumptions included in this presentation are based upon current market conditions, reflect our judgment as of the date of this presentation, and are subject to change. Past performance is no guarantee of future results. All investments involve risk including the loss of principal. All material presented is compiled from sources believed to be reliable, but accuracy cannot be guaranteed and Evergreen makes no representation as to its accuracy or completeness. Securities highlighted or discussed in this communication are mentioned for illustrative purposes only and are not a recommendation for these securities. Evergreen actively manages client portfolios and securities discussed in this communication may or may not be held in such portfolios at any given time.