

Click here to view as PDF. “The recent collapse is the climax, not the end, of an exceptionally long, extensive and violent period of inflation in securities prices and national, even worldwide, speculative fever.” –Business Week (now Bloomberg Business Week), November 2nd…1929! “We’re in a hell of a mess.” –Former Fed chairman PAUL VOLCKER in a New York Times article in late October of last year, just as the US stock market was beginning to crack
INTRODUCTION
At the beginning of 2018, we initiated a new EVA series titled “Bubble 3.0” with excerpts from David Hay’s upcoming book titled “Bubble 3.0: How Central Banks Created the Next Financial Crisis”. If you are just joining us in the middle of this ongoing series, which will eventually culminate in a full-length publication, please take a few moments to review the prior installments in the series:- Biggest Bubble Ever Quarterly Webinar (February 9, 2018)
- Bubble 3.0: How Central Banks Created the Next Financial Crisis (April 27, 2018)
- Bubble 3.0: How Did We Get Here? (Part I) (June 1, 2018)
- Bubble 3.0: How Did We Get Here? (Part II) (June 8, 2018)
- Bubble 3.0: A Fast and Furious Challenge (July 6, 2018)
- Bubble 3.0: Up from the Ashes (August 24, 2018)
- Bubble 3.0: The Biggest Bubble Inside the Biggest Bubble Ever (September 21, 2018)
- Bubble 3.0: What Could Go Right (October 12, 2018)
- Bubble 3.0: The Upside of Downside (November 30, 2018)
- Special Edition EVA: The Stealth Bear Market (December 14, 2018)
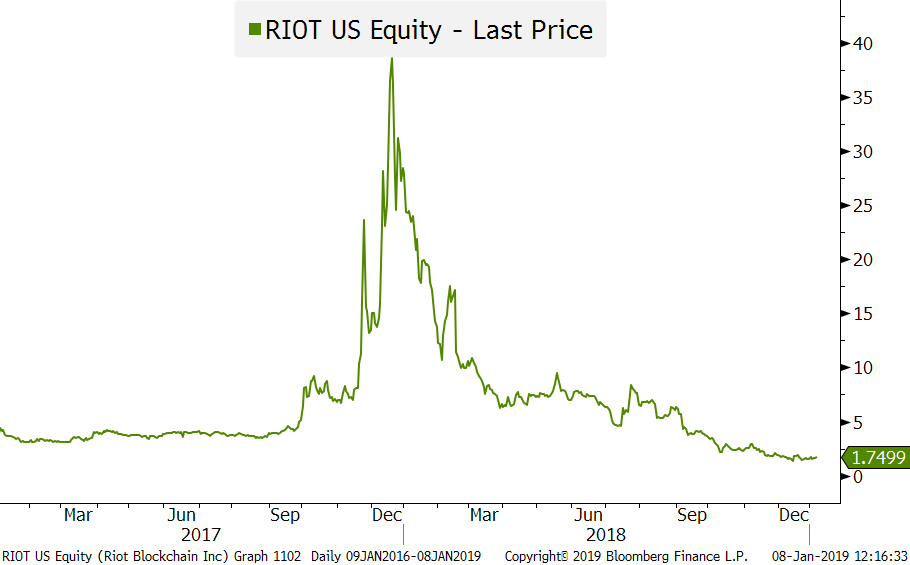
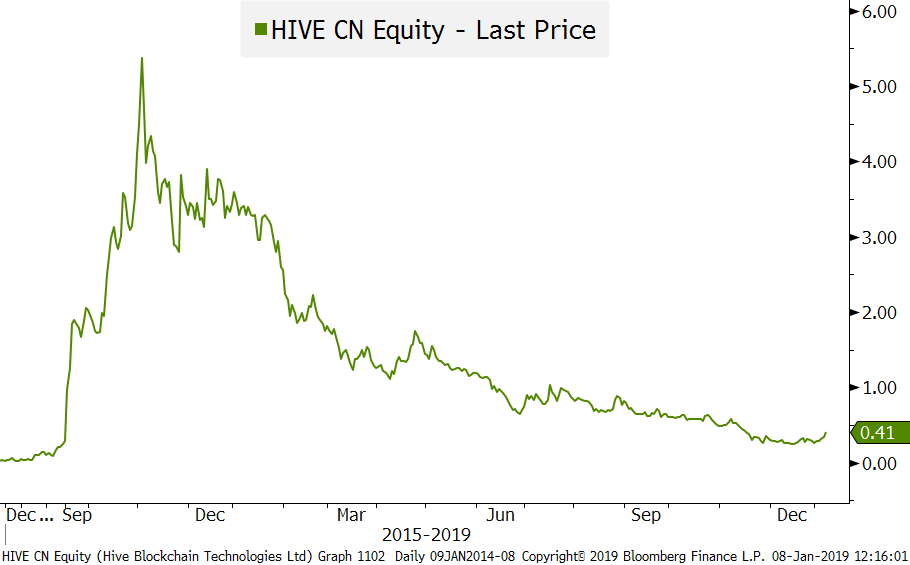
WHAT PRICE PROSPERITY? (PART I) In a prior Bubble 3.0 EVA, I’d mentioned that my intent was to write a chapter on the eventual costs of the frantic efforts by global central banks to artificially create economic good times. It was a little over a year ago, as Bubble 3.0 inflated to gargantuan dimensions, when I accidentally kicked off what would become a book written in real-time. The unintended inaugural issue, titled “Bubble-Watch”, was published on December 22nd, 2017, several months before I had decided to formally write “Bubble 3.0”. The reason this timing matters is that it almost precisely coincided with the peaking of the most outrageous speculative frenzy of this particular era, Bitcoin mania. As you may recall, what happened in late 2017 involved many other derivatives of Bitcoin, the multitude of crypto-currencies. The rapid proliferation by these strange things (frankly, I’m not sure what else to call them) at the end of 2017 and into early 2018 called into question one of the supposed prime attractions: their scarcity value. You may also remember that this bubble, which actually eclipsed the greatest asset inflation previously seen in human history—the Tulip Bulb insanity in Holland during the early 1600s—involved more than just the cryptos themselves. As chronicled at the time in the “Bubble Watch EVA”, numerous US companies cynically exploited investor fascination with cryptos and the related blockchain technology. Several companies – some with businesses not even closely related to blockchain tech – changed their name to include blockchain and saw their share prices rise astronomically. This behavior was a virtual clone of the
RIOT BLOCKCHAIN INC.
HIVE BLOCKCHAIN TECHNOLOGIES LTD.
Source: Bloomberg, Evergreen Gavekal as of 1/7/2019
During this phase, Evergreen received an unusual number of queries from our typically conservative client base asking for our thoughts. An initial trickle turned into a torrent of calls and emails as the price approached $20,000, up from less than $1,000 just months earlier. Our team consistently advised that this had all the classic characteristics of a bubble, including a sexy story and an almost impossible-to-disprove valuation calculus. (Who really had any idea what those “coins” were worth other than the last quote?)
CNBC fed the frenzy by offering extensive air-time to those infusing helium into the ever-expanding blimp. A series of telegenic and persuasive Bitcoin boosters would throw out audacious price targets and for many weeks those would be hit almost instantly. This, of course, gave them great credibility in the minds of the millions around the world desperate to get in on the action.
(To its credit, CNBC recently aired a segment devoted to the shows they had done with the bubble-blowers at the time. It was fascinating—and borderline hysterical—to see how ridiculously wrong their forecasts turned out to be. One of the glibbest was at it again, in a follow-up interview, insisting, even now, that it’s just a matter of time before Bitcoin hits $150,000. You’ve got to give him credit for chutzpah, if not contrition.)*
It’s hard to know how much wealth was created and then almost instantly destroyed globally (the crypto craze was very much a global phenomenon) through this extreme manifestation of human avarice—and stupidity. But a conservative estimate is in the hundreds of billions; a more realistic guess is well over a trillion considering how much was lost by directly investing in 
 Yet, for most of the past year since I’ve been on this bubble-busting crusade, I have felt like one of those Old Testament prophets who were about as popular in their day as a plague of locusts. It’s simply human nature not to want to hear that the good times are based on a false premise—that free money can create prosperity—and, more importantly, that they can’t, and won’t, last. Bummer! But more of a bummer is to be victimized by the inevitable return to reality.
For sure, this reasoning has been a very hard sell—like pitching a faith-based story to Hollywood (been there, failed that)—even as a growing list of assets around the world began to break down. As long as the S&P 500 was still charging higher, even though it was being led by a shrinking number of stocks, the theme that the entire economic and financial environment was at grave risk played about as well as an old Frank Sinatra tune at a rave.
Ironically, September 21st of last year, the date we ran the “Biggest Bubble Inside the Biggest Bubble Ever” EVA, was almost precisely the breaking point for the formerly titanium-ribbed S&P 500. What has happened since is shocking, even to worry-warts such as yours truly. It’s not that the damage to the index has been all that severe. As I write this, the main US index is down just 12%, which is really nothing more than a standard-issue correction. But there are a few things that make it seem much worse than this unremarkable number.
First, the fact that it has dropped at all after so many years of slow but relentless appreciation is stunning in its own right. Thanks to the manipulations of those clever monetary mandarins (thank you, Jim Grant for that apt label)—including direct purchases of equities with fabricated funds—investors had come to believe that the US stock market was a magical money machine and not the wickedly unpredictable beast it has been ever since its genesis over two-hundred years ago.
Second, what had been an almost volatility-free environment, at least of the downside variety, suddenly became, in early October, one of the most turbulent markets seen in many years. And, unfortunately for the never-say-sell crowd, the bulk of the extreme fluctuations have been in the wrong direction.
Thirdly, and most importantly, the damage done to the majority of US stocks has been far worse than the aforementioned 12% pull-back in the S&P. In fact, with nearly all of the former darlings (read: the FAANG stocks) having suffered 20% to 30% swoons, and a host of less adulated issues having tanked 40% to 70%, it’s amazing to me that the official index is down as little as it is. This development, as noted in the December 14, 2018 EVA, has caused me to refer to this as a two-tier market. In other words, it is characterized by a crowded (though less so) cohort of still-overpriced stocks alongside a growing raft of bombed-out issues trading for single-digit P/E ratios. For example, check out the 50 times earnings valuation of the largest publicly-traded Mexican food chain, with a history of serious food-safety problems. Then contrast that with one of the nation’s largest and most content-rich media companies trading at a mere nine times what it earned over the past year (i.e., past, not hoped-for earnings).
Putting that puzzle aside, the fact that a 12% drop in US stocks represents about $4 trillion of lost shareholder value is still a very large number—and it is likely to have an equally large impact on consumer attitudes. This is a reality that is already showing up in previously Himalayan-high consumer sentiment surveys. You may have noticed, lately those have been cracking, as are a wide range of leading economic indicators. (As a topical side note, last Friday, January 4th, 2019, the US stock market had another one of its spectacular rallies, sending the Dow up nearly 750 points. In Evergreen’s view this is once again a typical bear market eruption, in this case caused by a strong jobs report. The flaw in the logic that this release indicates a robust economy is due to the fact the unemployment rate is among the most backward-looking datapoints. A much more future-focused measure is the Purchasing Managers New Order Index which collapsed by a jaw-dropping 11%, as reported on January 3rd.)
It is this nearly overnight multi-trillion dollar net-worth disappearance–caused by pumping up asset values to precarious heights—that seems to have been lost on all the central bankers who have been convinced free-money was the answer to all that ails the planet. Frankly, up until lately, questioning the end-game seemed like an exercise in sour grapes for people like myself. The fact that the Great Reckoning has been delayed for many years has made the non-believers among us seem churlish—if not downright foolish (I’ve certainly heard plenty of the latter feedback).
To be fair to the monetary powers-that-be, their belief was always that economic growth would become vigorous enough as a result of their collective $15 trillion asset levitation that they would then be able to raise rates to more normal levels without causing major disruptions. This is what I’ve long referred to as The Immaculate Correction scenario. A year ago, with the world supposedly enjoying a “synchronized global expansion”, that seemed somewhat plausible—until various markets around the world began to break down.
The central banks also hoped the same would be true with said $15 trillion of QE (quantitative easing) that would theoretically need to be taken off their balance sheets, mostly bonds that have been bought with fake money. This is what the Fed is currently attempting to do at a $50 billion per month clip, a process becoming widely known as Quantitative Tightening.
For well over a year, numerous prior EVAs have been warning about the dangers posed by the first ever “double tightening” (i.e., both raising rates and reversing a decade of QEs). As with most of my warnings, these have been largely dismissed, even ridiculed—until recently. It’s now become inescapably clear that the Fed is in a no-win position, as I’ve previously speculated. The new King of Bonds, Jeff Gundlach, was interviewed at length on CNBC right before Christmas and he summed it up perfectly, in my view: “The Fed is damned if they do and damned if they don’t.”
In other words, if it keeps tightening, it risks further roiling financial markets and increasing the already rapidly rising worldwide recession risks (per the below chart from Ned Davis Research). Yet, if the Fed stops now, it sends a signal that it’s caving into presidential pressure and/or that it’s more worried about the economic outlook than it officially admits.
Yet, for most of the past year since I’ve been on this bubble-busting crusade, I have felt like one of those Old Testament prophets who were about as popular in their day as a plague of locusts. It’s simply human nature not to want to hear that the good times are based on a false premise—that free money can create prosperity—and, more importantly, that they can’t, and won’t, last. Bummer! But more of a bummer is to be victimized by the inevitable return to reality.
For sure, this reasoning has been a very hard sell—like pitching a faith-based story to Hollywood (been there, failed that)—even as a growing list of assets around the world began to break down. As long as the S&P 500 was still charging higher, even though it was being led by a shrinking number of stocks, the theme that the entire economic and financial environment was at grave risk played about as well as an old Frank Sinatra tune at a rave.
Ironically, September 21st of last year, the date we ran the “Biggest Bubble Inside the Biggest Bubble Ever” EVA, was almost precisely the breaking point for the formerly titanium-ribbed S&P 500. What has happened since is shocking, even to worry-warts such as yours truly. It’s not that the damage to the index has been all that severe. As I write this, the main US index is down just 12%, which is really nothing more than a standard-issue correction. But there are a few things that make it seem much worse than this unremarkable number.
First, the fact that it has dropped at all after so many years of slow but relentless appreciation is stunning in its own right. Thanks to the manipulations of those clever monetary mandarins (thank you, Jim Grant for that apt label)—including direct purchases of equities with fabricated funds—investors had come to believe that the US stock market was a magical money machine and not the wickedly unpredictable beast it has been ever since its genesis over two-hundred years ago.
Second, what had been an almost volatility-free environment, at least of the downside variety, suddenly became, in early October, one of the most turbulent markets seen in many years. And, unfortunately for the never-say-sell crowd, the bulk of the extreme fluctuations have been in the wrong direction.
Thirdly, and most importantly, the damage done to the majority of US stocks has been far worse than the aforementioned 12% pull-back in the S&P. In fact, with nearly all of the former darlings (read: the FAANG stocks) having suffered 20% to 30% swoons, and a host of less adulated issues having tanked 40% to 70%, it’s amazing to me that the official index is down as little as it is. This development, as noted in the December 14, 2018 EVA, has caused me to refer to this as a two-tier market. In other words, it is characterized by a crowded (though less so) cohort of still-overpriced stocks alongside a growing raft of bombed-out issues trading for single-digit P/E ratios. For example, check out the 50 times earnings valuation of the largest publicly-traded Mexican food chain, with a history of serious food-safety problems. Then contrast that with one of the nation’s largest and most content-rich media companies trading at a mere nine times what it earned over the past year (i.e., past, not hoped-for earnings).
Putting that puzzle aside, the fact that a 12% drop in US stocks represents about $4 trillion of lost shareholder value is still a very large number—and it is likely to have an equally large impact on consumer attitudes. This is a reality that is already showing up in previously Himalayan-high consumer sentiment surveys. You may have noticed, lately those have been cracking, as are a wide range of leading economic indicators. (As a topical side note, last Friday, January 4th, 2019, the US stock market had another one of its spectacular rallies, sending the Dow up nearly 750 points. In Evergreen’s view this is once again a typical bear market eruption, in this case caused by a strong jobs report. The flaw in the logic that this release indicates a robust economy is due to the fact the unemployment rate is among the most backward-looking datapoints. A much more future-focused measure is the Purchasing Managers New Order Index which collapsed by a jaw-dropping 11%, as reported on January 3rd.)
It is this nearly overnight multi-trillion dollar net-worth disappearance–caused by pumping up asset values to precarious heights—that seems to have been lost on all the central bankers who have been convinced free-money was the answer to all that ails the planet. Frankly, up until lately, questioning the end-game seemed like an exercise in sour grapes for people like myself. The fact that the Great Reckoning has been delayed for many years has made the non-believers among us seem churlish—if not downright foolish (I’ve certainly heard plenty of the latter feedback).
To be fair to the monetary powers-that-be, their belief was always that economic growth would become vigorous enough as a result of their collective $15 trillion asset levitation that they would then be able to raise rates to more normal levels without causing major disruptions. This is what I’ve long referred to as The Immaculate Correction scenario. A year ago, with the world supposedly enjoying a “synchronized global expansion”, that seemed somewhat plausible—until various markets around the world began to break down.
The central banks also hoped the same would be true with said $15 trillion of QE (quantitative easing) that would theoretically need to be taken off their balance sheets, mostly bonds that have been bought with fake money. This is what the Fed is currently attempting to do at a $50 billion per month clip, a process becoming widely known as Quantitative Tightening.
For well over a year, numerous prior EVAs have been warning about the dangers posed by the first ever “double tightening” (i.e., both raising rates and reversing a decade of QEs). As with most of my warnings, these have been largely dismissed, even ridiculed—until recently. It’s now become inescapably clear that the Fed is in a no-win position, as I’ve previously speculated. The new King of Bonds, Jeff Gundlach, was interviewed at length on CNBC right before Christmas and he summed it up perfectly, in my view: “The Fed is damned if they do and damned if they don’t.”
In other words, if it keeps tightening, it risks further roiling financial markets and increasing the already rapidly rising worldwide recession risks (per the below chart from Ned Davis Research). Yet, if the Fed stops now, it sends a signal that it’s caving into presidential pressure and/or that it’s more worried about the economic outlook than it officially admits.
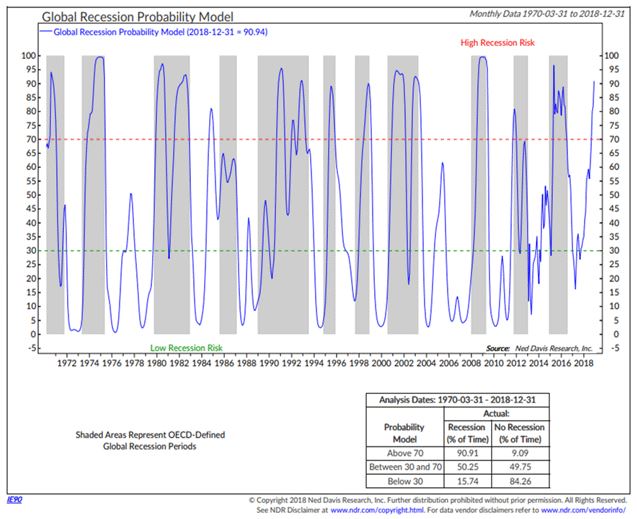
Source: Ned Davis Research as of 12/31/2018
Ergo, we’ve gotten to the point where the markets are no longer blowing off the double-tightening as they did for so long. Now, instead, each new hike creates severe consternation among investors. Moreover, the threat of being “a long way from neutral”, as Fed Chairman Jay Powell innocuously, but now infamously, mused in mid-October, injects sheer terror into the hearts and minds of the once-fearless 
Source: Forbes as of 9/5/2018
*While I am both frustrated and embarrassed to have underestimated how long Bubble 3.0 would last, I do take solace in having been extremely vocal about the lunacy of the crypto-currency mania. We don’t expect any kudos, but long-time Evergreen clients and EVA readers (since 2005 when this newsletter began) may recall that this is at least the fourth bubble we called out before the implosion. (Tech in the late 1990s, Chinese stocks in 2007, and the housing market from 2005 through 2007.) We think Bubble 3.0 will add to that list, despite its long-postponed rendezvous with reality. If, and when, it does, the current measly 4.8% return including dividends on the S&P 500 since 12/31/99 will become even more underwhelming.

OUR CURRENT LIKES AND DISLIKES
No changes this week.
LIKE *- Large-cap growth (select issues are looking much more attractive after the recent meltdown)
- Some international developed markets (especially Japan)
- Cash
- Publicly-traded pipeline partnerships (MLPs and other mid-stream energy securities) yielding 7%-15% (as a result of the powerful rally of the first three trading days of the year, buy more selectively)
- Gold-mining stocks
- Gold
- Select blue chip oil stocks (also buy aggressively due to the utter capitulation in the energy sector)
- One- to two-year Treasury notes
- Canadian dollar-denominated short-term bonds
- Short-term investment grade corporate bonds (1-2 year maturities)
- Emerging market bonds in local currency (start a dollar-cost-averaging process and be prepared to buy more on further weakness)
- Mexican stocks (due to the recent severe selloff, we are adding back exposure to a Mexican REIT that we sold materially higher)
- Large-cap value (there are a plethora of bargains now in this area)
- Intermediate municipal bonds with strong credit ratings
- Intermediate-term Treasury bonds (especially the five-year maturity)
- Most cyclical resource-based stocks (some are looking more attractive)
- Mid-cap growth
- Emerging stock markets; however, a number of Asian developing markets appear undervalued
- Solar Yield Cos
- Canadian REITs
- Intermediate-term investment-grade corporate bonds, yielding approximately 4%
- US-based Real Estate Investment Trusts (REITs)
- Long-term investment grade corporate bonds
- Long-term municipal bonds
- Short euro ETF
- Long-term Treasury bonds
- Investment-grade floating rate corporate bonds
- Select European banks
- Small-cap growth
- Preferred stocks
- Small-cap value (start covering shorts)
- Mid-cap value
- Lower-rated junk bonds
- Floating-rate bank debt (junk)
- US industrial machinery stocks (such as one that runs like a certain forest animal, and another famous for its yellow-colored equipment)
- BB-rated corporate bonds (i.e., high-quality, high yield; in addition to rising rates, credit spreads look to be widening) * **
- Short yen ETF (i.e., we believe the yen is poised to rally)
- Dim sum bond ETF; individual issues, such as blue-chip multi-nationals, are attractive if your broker/custodian is able to buy them