

Click here to view as PDF. “We’ve got a monetary policy that still seems like it is in the remnants of a Depression era.” -JES STALEY, Barclays CEO “(The) euro area economy is booming and (it’s) not at all consistent with a monetary policy that is appropriate for a destabilizing depression.” -DAVID ROSENBERG, arguably Canada’s most renowned economist
INTRODUCTION
Another EVA, another chance to read the thoughts of one of the planet’s smartest men, Anatole Kaletsky! This week’s issue is a follow-up to the January 26th edition, also by Anatole, titled “The Big Questions for 2018”. Among those urgent queries is one I personally believe might be the King Kong of them all: is the global bond market on the verge of a meltdown? If the answer is yes—and even the ever-bullish Anatole allows for the possibility—the implications are enormous. How many times have we heard that stocks are cheap relative to bonds? This logic conveniently ignores that share prices, especially in the US, are terrifyingly expensive based on nearly every other measure. Here’s one that has long been Warren Buffett’s favorite barometer of under- or over-valuation.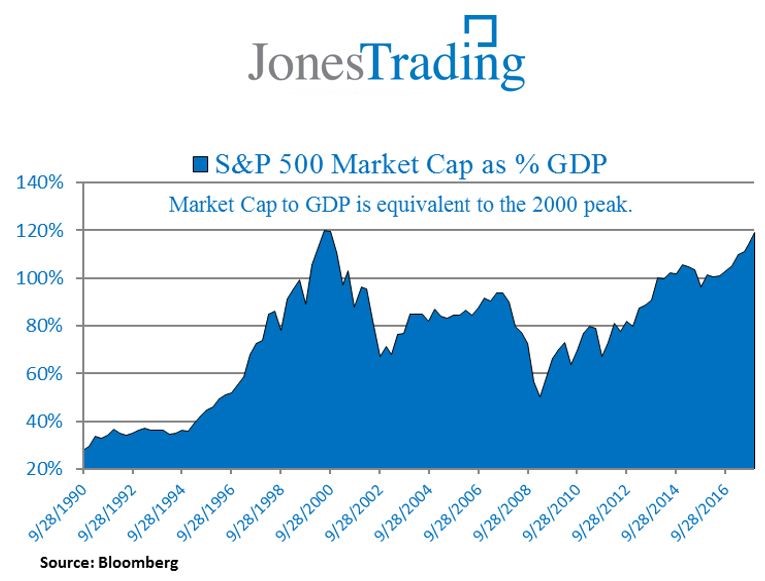 As you will read below, Anatole points out that mid-2016—when yields on 10-year US treasury notes crashed down to 1.3% and $12 trillion of bonds around the world had negative rates—was “arguably the greatest financial bubble of all time”. In my mind, he was right, and actually still is, and there’s really no arguing about it. But what he doesn’t point out is that there remains nearly $10 trillion of bonds with negative interest rates. In one of the most extreme examples of the absurdity of this money for nothing—or less than nothing—era was a junk bond that came to market in Europe late last year with a negative interest rate!
By merely focusing on the insane valuation of bonds, primarily outside of the US, what is missed is the impact this phenomenon has on virtually everything else. As noted above, the Lilliputian level of interest rates has been continually used as a rationale to justify extreme stock valuations. But they have also directly impacted the price of real estate, driving property values up to, or even beyond, 2007 levels. This utter collapse in the cost of money is the prime reason Evergreen has dubbed this the Biggest Bubble Ever (BBE) across the major asset classes of stocks, bonds, and real estate.
Consequently, I believe the answers to Anatole’s five bond questions are of paramount importance to all investors. One point he makes, with which I completely concur, is that the 2.60% yield threshold, or thereabouts, is crucial. This high point in rates has consistently held ever since 2013’s “taper tantrum,” when then Fed-head Ben Bernanke floated the trial balloon of ending Quantitative Easing (QE) III. As Anatole also notes, there is no “resistance”, in technical analysis parlance, from around that point until 3% where yields topped out during the tantrum. Further, because countless investors (and computers!) have been eye-in-the-sky focused on 2.6%, a decisive break was highly likely to create a self-fulfilling selling frenzy. That upside penetration became apparent last Monday, and sure enough, the yield on the 10-year has sprinted to 2.85% as I write these words. We’ve updated Anatole’s chart to highlight the significance of this development.
As you will read below, Anatole points out that mid-2016—when yields on 10-year US treasury notes crashed down to 1.3% and $12 trillion of bonds around the world had negative rates—was “arguably the greatest financial bubble of all time”. In my mind, he was right, and actually still is, and there’s really no arguing about it. But what he doesn’t point out is that there remains nearly $10 trillion of bonds with negative interest rates. In one of the most extreme examples of the absurdity of this money for nothing—or less than nothing—era was a junk bond that came to market in Europe late last year with a negative interest rate!
By merely focusing on the insane valuation of bonds, primarily outside of the US, what is missed is the impact this phenomenon has on virtually everything else. As noted above, the Lilliputian level of interest rates has been continually used as a rationale to justify extreme stock valuations. But they have also directly impacted the price of real estate, driving property values up to, or even beyond, 2007 levels. This utter collapse in the cost of money is the prime reason Evergreen has dubbed this the Biggest Bubble Ever (BBE) across the major asset classes of stocks, bonds, and real estate.
Consequently, I believe the answers to Anatole’s five bond questions are of paramount importance to all investors. One point he makes, with which I completely concur, is that the 2.60% yield threshold, or thereabouts, is crucial. This high point in rates has consistently held ever since 2013’s “taper tantrum,” when then Fed-head Ben Bernanke floated the trial balloon of ending Quantitative Easing (QE) III. As Anatole also notes, there is no “resistance”, in technical analysis parlance, from around that point until 3% where yields topped out during the tantrum. Further, because countless investors (and computers!) have been eye-in-the-sky focused on 2.6%, a decisive break was highly likely to create a self-fulfilling selling frenzy. That upside penetration became apparent last Monday, and sure enough, the yield on the 10-year has sprinted to 2.85% as I write these words. We’ve updated Anatole’s chart to highlight the significance of this development.
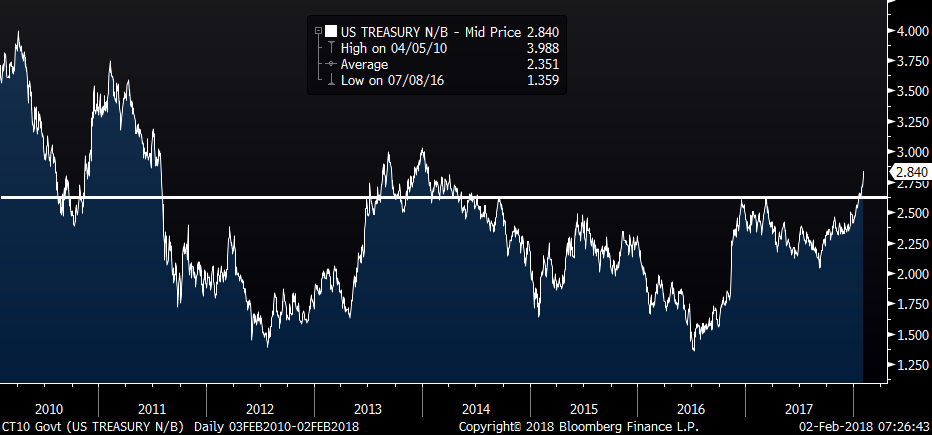 Source: Bloomberg, Evergreen Gavekal

THE 5 BIG BOND MARKET QUESTIONS By Anatole Kaletsky With 10-year US treasury yields near the point of breaking out above their 2017 high of 2.6%, financial commentators around the world have suddenly become obsessed with a single question: Have bonds finally entered a bear market, after the multi-decade bull trend that started back in October 1981, when the 10-year yield peaked at 15.8%? There is only one sensible answer to this debate: Who cares? No agreed definition exists of what might constitute a bond bear market, comparable to the conventional -20% peak-to-trough decline in equity parlance; so it isn’t clear whether the question even means anything. If a bear market is defined simply as a persistent sequence of lower lows and lower highs, then the bear market in bonds actually began 18 months ago. After all, it is almost inconceivable that bonds will ever again see the ridiculous levels of June 2016, when a third of all developed market government debt, almost US$12trn by face value, was trading on negative yields, in what was arguably the greatest financial bubble of all time. So instead of quibbling about semantics, it is worth asking five more important questions as yields threaten to break through their 2017 high:
- Will the US 10-year yield rise above the 3% ceiling that has held since mid-2011?
- If US yields rise to 3% or above, will this put an end to the equity bull market?
- If US yields rise to 3% or higher, will European and Japanese yields also break out of their long-term trading ranges?
- If US yields rise to 3% or more, but European and Japanese yields remain at much lower levels, what will this mean for the relative performance of equities, property and other assets denominated in euros, yen or emerging market currencies?
- If equity bull markets continue despite rising bond yields, will bond positions remain an appropriate hedge against equity volatility, as they have been for the past 35 years?
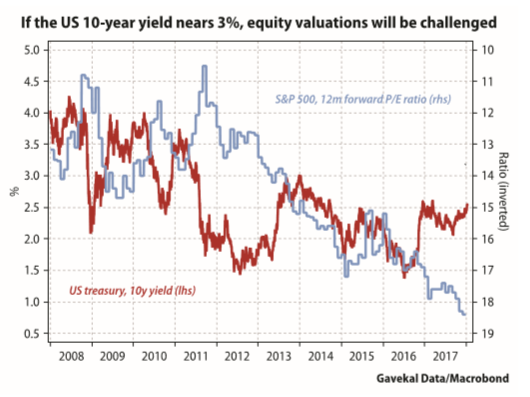 2. If the 10-year US treasury yield rises into the 2.6-3% range, current US equity valuations will be challenged, since the forward P/E ratio on the S&P 500 was around 15 when yields last exceeded the 2.6% level in 2014. In this range, the equity bull market could still continue, driven by investor rotation out of very long-duration equities such as technology stocks with high P/Es into shorter-duration cyclical stocks (i.e. lower P/E “value” stocks) which are trading on much less demanding multiples. But if the 10-year yield rises much above 3%, valuations anywhere near present levels will be hard to sustain and US equities will probably suffer a deep correction.
3. If 10-year US treasury yields rise above 2.6%, or even 3%, Japanese or German bonds will doubtless also rise, especially if the European Central Bank and Bank of Japan continue to taper. But it is extremely unlikely that 10-year bund yields will move above their post-2014 ceiling of 1% or 10-year Japanese government bond yields above their post-2014 ceiling of 0.6%, since there is no prospect of either the ECB or the BoJ hiking short rates above zero for at least another year, and possibly much longer.
4. The discount rates applied to future European and Japanese profits should be based on bond yields in euros and yen, not in US dollars. So if 10-year yields in euros and yen remain below 1% (and they will probably be quite a lot lower), European and Japanese equity multiples should keep moving higher, even if US equity valuations suffer from higher US dollar interest rates. A moderate and gradual rise in US bond yields should therefore drive further equity rotation out of Wall Street into European and Japanese markets. If, however, the rise in US bond yields becomes so severe that it triggers a deep correction or full scale bear market on Wall Street, equities elsewhere are unlikely to remain unscathed.
5. Finally, it seems clear that the main threat to equity valuations in the year ahead is a steep rise in bond yields, not a slowdown in economic growth. If this is indeed the case, then long duration bonds are no longer an effective hedge against equity risk. If the world is moving from a deflationary to an inflationary or expansionary environment, equity exposure needs to be balanced with cash, commodities, gold or other inflation hedges. Bonds, far from stabilizing the portfolio, could soon become an amplifier of equity risks.
2. If the 10-year US treasury yield rises into the 2.6-3% range, current US equity valuations will be challenged, since the forward P/E ratio on the S&P 500 was around 15 when yields last exceeded the 2.6% level in 2014. In this range, the equity bull market could still continue, driven by investor rotation out of very long-duration equities such as technology stocks with high P/Es into shorter-duration cyclical stocks (i.e. lower P/E “value” stocks) which are trading on much less demanding multiples. But if the 10-year yield rises much above 3%, valuations anywhere near present levels will be hard to sustain and US equities will probably suffer a deep correction.
3. If 10-year US treasury yields rise above 2.6%, or even 3%, Japanese or German bonds will doubtless also rise, especially if the European Central Bank and Bank of Japan continue to taper. But it is extremely unlikely that 10-year bund yields will move above their post-2014 ceiling of 1% or 10-year Japanese government bond yields above their post-2014 ceiling of 0.6%, since there is no prospect of either the ECB or the BoJ hiking short rates above zero for at least another year, and possibly much longer.
4. The discount rates applied to future European and Japanese profits should be based on bond yields in euros and yen, not in US dollars. So if 10-year yields in euros and yen remain below 1% (and they will probably be quite a lot lower), European and Japanese equity multiples should keep moving higher, even if US equity valuations suffer from higher US dollar interest rates. A moderate and gradual rise in US bond yields should therefore drive further equity rotation out of Wall Street into European and Japanese markets. If, however, the rise in US bond yields becomes so severe that it triggers a deep correction or full scale bear market on Wall Street, equities elsewhere are unlikely to remain unscathed.
5. Finally, it seems clear that the main threat to equity valuations in the year ahead is a steep rise in bond yields, not a slowdown in economic growth. If this is indeed the case, then long duration bonds are no longer an effective hedge against equity risk. If the world is moving from a deflationary to an inflationary or expansionary environment, equity exposure needs to be balanced with cash, commodities, gold or other inflation hedges. Bonds, far from stabilizing the portfolio, could soon become an amplifier of equity risks.
OUR CURRENT LIKES AND DISLIKES
No changes this week.
LIKE
- Large-cap growth (during a correction)
- International developed markets (during a correction)
- Cash
- Publicly-traded pipeline partnerships (MLPs) yielding 7%-12% (buy less aggressively due to the recent sharp rally)
- Gold-mining stocks
- Gold
- Select blue chip oil stocks (wait for a pull-back after their recent strong run)
- Mexican stocks (at lower prices after this year’s robust rally)
- Bonds denominated in renminbi trading in Hong Kong (dim sum bonds)
- Short euro ETF (due to the euro’s weakness of late, refrain from initiating or adding to this short)
- Intermediate municipal bonds with strong credit ratings
- Investment-grade floating rate corporate bonds
NEUTRAL
- Most cyclical resource-based stocks
- Short-term investment grade corporate bonds
- High-quality preferred stocks yielding 6%
- Mid-cap growth
- Emerging stock markets, however a number of Asian developing markets, ex-India, appear undervalued
- Select European banks
- BB-rated corporate bonds (i.e., high-quality, high yield)
- Long-term Treasury bonds
- Long-term investment grade corporate bonds
- Intermediate-term Treasury bonds
- Long-term municipal bonds
- Emerging bond markets (dollar-based or hedged); local currency in a few select cases
- Solar Yield Cos (taking partial profits on these)
- Large-cap value
- Canadian REITs
- Intermediate-term investment-grade corporate bonds, yielding approximately 4%
DISLIKE
- US-based Real Estate Investment Trusts (REITs) (once again, some small-and mid-cap issues appear attractive; also, some retail-exposed REITs look deeply undervalued)
- Small-cap value
- Mid-cap value
- Small-cap growth
- Lower-rated junk bonds
- Canadian dollar-denominated bonds (the loonie is currently overbought)
- Short yen ETF (in fact, the yen looks poised to rally)
- Emerging market bonds (local currency)
- Emerging market bonds (local currency)
- Floating-rate bank debt (junk)
- US industrial machinery stocks (such as one that runs like a certain forest animal, and another famous for its yellow-colored equipment)
DISCLOSURE: This material has been prepared or is distributed solely for informational purposes only and is not a solicitation or an offer to buy any security or instrument or to participate in any trading strategy. Any opinions, recommendations, and assumptions included in this presentation are based upon current market conditions, reflect our judgment as of the date of this presentation, and are subject to change. Past performance is no guarantee of future results. All investments involve risk including the loss of principal. All material presented is compiled from sources believed to be reliable, but accuracy cannot be guaranteed and Evergreen makes no representation as to its accuracy or completeness. Securities highlighted or discussed in this communication are mentioned for illustrative purposes only and are not a recommendation for these securities. Evergreen actively manages client portfolios and securities discussed in this communication may or may not be held in such portfolios at any given time.