


Click here to view as PDF. “Up, up and away, my beautiful, my beautiful balloon!” -THE FIFTH DIMENSION
INTRODUCTION
Into the Wild Blue Yonder. It’s not often that I get a chance to send out one of our newsletters containing fodder for both the bulls and bears. However, in this week’s Guest EVA edition, I am able to do exactly that and, for bonus points, at least for me, to highlight the latest musings of one of my heroes, Jeremy Grantham. As many long-time EVA readers are aware, Mr. Grantham is the co-founder of Boston-based GMO, which is among America’s largest privately-held money managers. Though GMO has been suffering outflows in recent years due to their defensive portfolio positioning, they continue to have approximately $74 billion in assets under management. “Asset shedding” is not a new occurrence at GMO. In fact, at the tail end of the last two bull markets, they saw clients defect in droves. Then, after the market tide went out—and we’re talking way, way out, like what happens right before a tsunami—they were inundated with assets once again. What is unusual this time, however, is that Mr. Grantham is in a most unfamiliar position at such an advanced stage of a bull run. Instead of his usual—and ultimately spot-on—role of warning against the dangers of overpaying for stocks, he’s lately on record as saying they have much further to go. But, as you may suspect, there is a catch…which is why this Guest EVA might be an all-around crowd pleaser. In his latest missive “Bracing Yourself for a Possible Near-term Melt-up”, Mr. Grantham makes the case for why “one of the highest priced markets in US history” might become even more so—eventually entering into unadulterated bubble territory. The good news for the plethora of bulls out there is that he thinks this might mean the S&P 500 will vault to a mid-point of 3550 (between a range of 3400 to 3700). Illustrating that we are likely already in the melt-up phase, he is apparently using a final lift-off point of around 2400 on the S&P which it traded at in the dark, distant past—like last August. At a recent S&P level of 2800, that works out to a more modest, but still considerable, 27% advance from here (again to the mid-point). Based on his analysis of prior full-blown bubbles (pun intended), this run could last another year. Of course, that’s just an approximation on his part so don’t set your watches—or sell orders—by it. And, as I’ve frequently noted, we’ve never before seen central banks merrily conjuring up $14 trillion of digitally synthesized money—and in some cases using it to directly buy stocks—creating a situation where there are $10 trillion of negative-yielding bonds globally. Therefore, it’s possible the timetable to bubble peak gets accelerated—or maybe not. Yes, I know it’s frustrating but I’ve often said that you can always tell a bubble, but you can’t tell when it’s going to burst (though, perhaps by sheer luck, this newsletter may have gotten it almost to the day with Bitcoin and friends; the jury is still out on that one). So, you might reasonably wonder, what’s in it for the bears? After all, it sounds like even more slaughtering of this rapidly vanishing breed, right? As you will soon read, that’s because a price of 3550 on the S&P would put it in a league with past epic bubbles. And, per Mr. Grantham’s prior analysis, ALL bubbles end in major declines and/or, typically, crashes. (It’s also noteworthy the consistency with which the gains seen in the last few years of an out-and-out bubble evaporate in about the next 12 months.) Despite bullish investors’ ardent hopes that this time is different, it never is—or at least it never has been—but maybe, just maybe, this might finally be the exception. It’s also interesting that Mr. Grantham wrote a predecessor piece to this just as Mr. Trump was being elected back in early November 2016. Barron’s ran it as a feature article at the time and, in it, Mr. Grantham accurately opined that the market would likely keep rising until it hit 2300—which would amount to, in geek-speak, a two-standard deviation event. In English, this means something that doesn’t happen very often; to be specific, about once every 44 years. The fact that we are now at 2800 would mean that, even tweaking his original 2300 bubble threshold by 7% or so to adjust for normal earnings growth, we are already fully engaged in yet another market mania. But he’s certainly got a point in comparing the slope of this increase with other “blow off top” phases of past stock bubbles and noting we might be in the midst of the straight up phase. As many others have observed recently, there is more than just a whiff of euphoria in the air these days, with the S&P 500 beginning to go vertical—one of the classic signs of a melt-up. The late stages of bubbles are glorious times for those who are fully invested. For those of us who believe in selling into rapidly rising markets, they are less so but are still much preferred to what comes next. In other words, it is much less painful to be making smaller gains than the
BRACING YOURSELF FOR A POSSIBLE NEAR-TERM MELT-UP By Jeremy Grantham * Editor’s note: Mr. Grantham’s missive was too long to present in full-form. As such, breaks in writing are marked with ellipses. For a full version of his piece, please click here. I find myself in an interesting position for an investor from the value school. I recognize on one hand that this is one of the highest-priced markets in US history. On the other hand, as a historian of the great equity bubbles, I also recognize that we are currently showing signs of entering the blow-off or melt-up phase of this very long bull market. The data on the high price of the market is clean and factual. We can be as certain as we ever get in stock market analysis that the current price is exceptionally high. In contrast, my judgment on the melt-up is based on a mish-mash of statistical and psychological factors based on previous eras, each one very different, so that much of the information available is not easily comparable. It also leans very heavily on a few US examples. Yet, strangely, I find the less statistical data more compelling in this bubble context than the simple fact of overpricing. Whether you will also, dear reader, remains to be seen. In any case, my task in this note is to present the evidence, both statistical and touchy-feely, as clearly as I can.
…
Is a late bubble surge beginning? So, let’s look at what is missing in the way of psychological and technical signs of a late-stage bubble and what is beginning to fall into place. On the topic of classic bubbles, I have long shown [the charts below]. They recognize the importance of a true psychological event of momentum increasing to a frenzy. That is to say, acceleration of price. The average time of the final bubble phase of the great equity bubbles shown in the [first set of charts] is just under 3.5 years, with the average upcycle of real acceleration just 21 months. And the two smaller equity bubbles had gains of 65% and 58%. They also show an interesting symmetry, don’t you think? Rising and falling at about the same rate, as did the real McCoy before them. Yes, there is a real danger of being late. And in general, average market declines are considerably faster than average advances. But historically, when dealing with real bubbles, being late has not been materially different in time and pain than being too early, as you can see. Value managers are historically painfully too early over and over again, as I know better than most.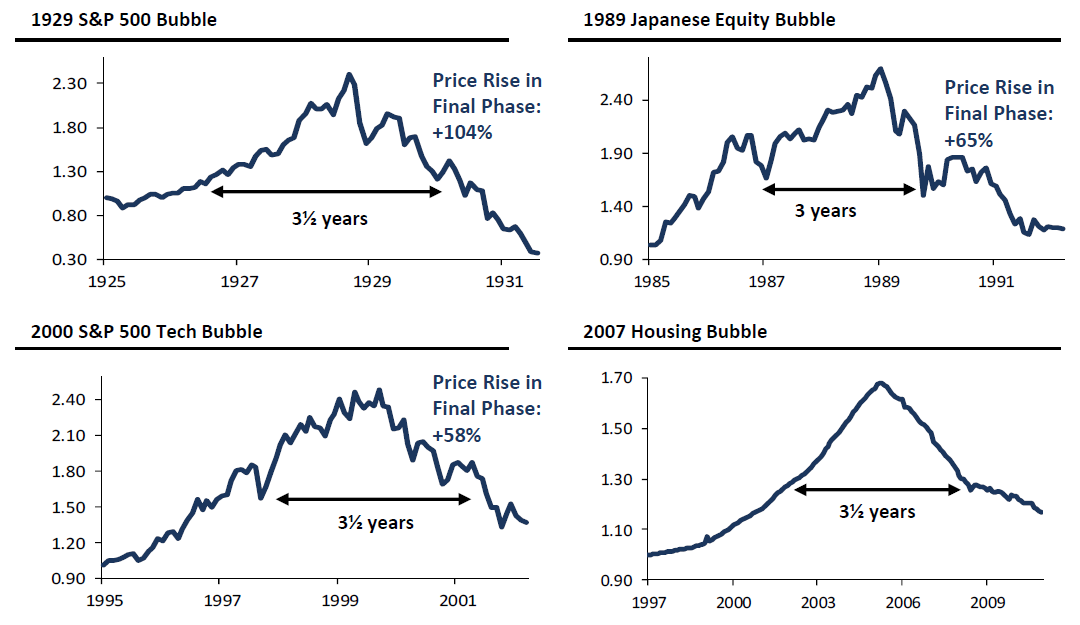 Source: Robert Shiller, Compustat, Worldscope, S&P, National Association of Realtors, GMO
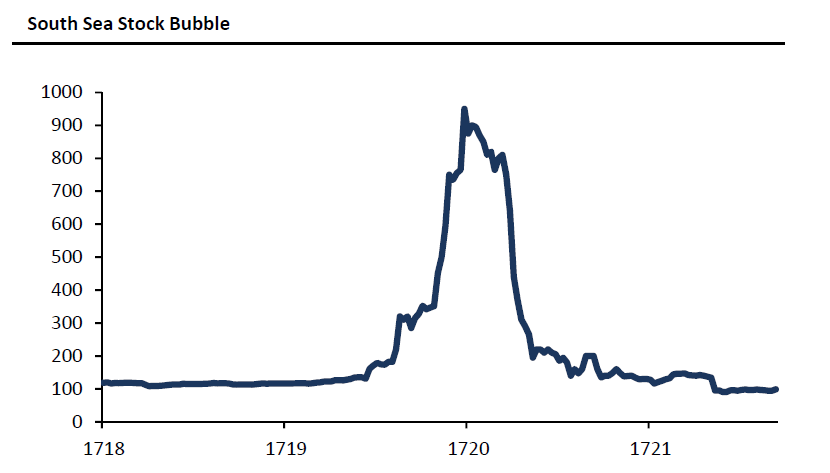 Source: Marc Faber, Editor and Publisher of “The Gloom, Boom & Doom Report.” (December 1718 – December 1721)
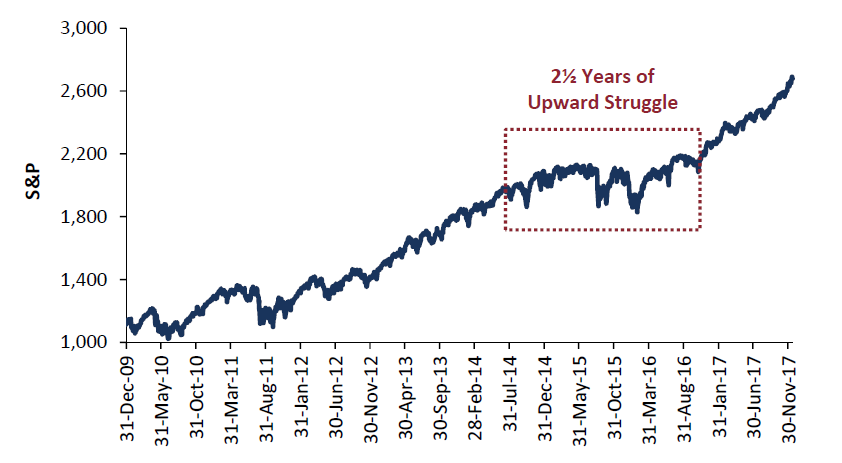
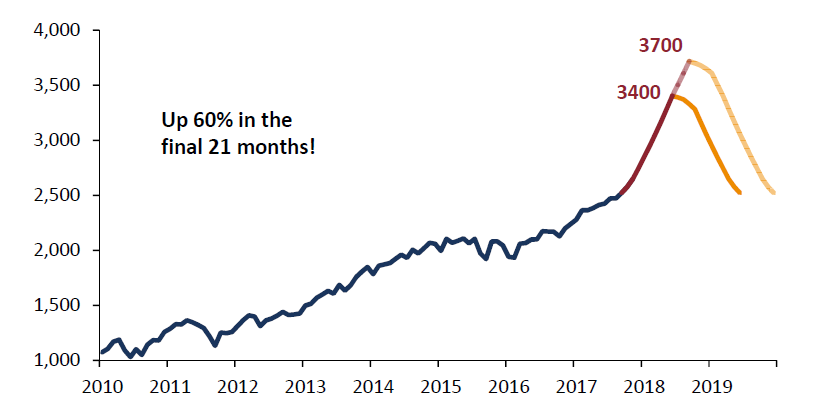
…
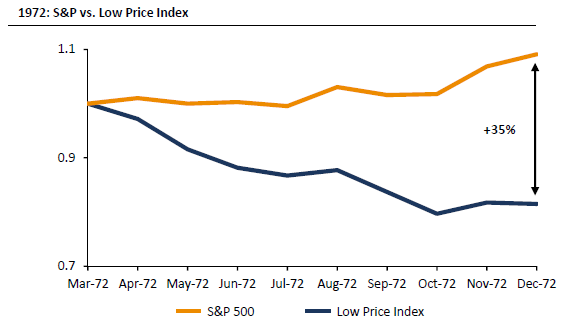
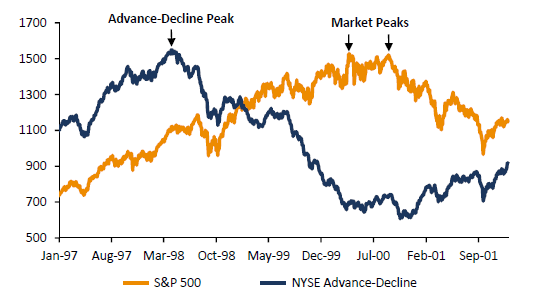
In looking for signs of late bubble behavior, we have to reconcile to the fact that no two bubbles, even the classics, are the same. They share the fact that there are many signs of investor euphoria, sometimes indeed approaching the madness of crowds, but the package of psychological and technical indicators has been different each time. The historian has to emphasize the big picture: In general are investors getting clearly carried away? Are prices accelerating? Is the market narrowing? And, are at least some of the other early warnings from the previous great bubbles falling into place? Increasing concentration and unusual outperformance of quality and low beta stocks These are really two separate points and they can occur separately, but sometimes the data overlaps so it’s convenient to examine them together. Between them I believe they are right behind acceleration in their effectiveness in warning of a late-stage bubble. First, the principles: Concentration is the essence of an escalating euphoria. By late-stage cycles, many buyers are fixating on “winners” with the purchase motive being further stock gains, rather than any logic of long-term value. Thus, as the market soars, attention is increasingly focused on those with the largest earnings and stock price gains, and interest in the B players falls away. (This concentration effect naturally favors larger companies, perhaps because they can better absorb a rising demand.) The second principle is the outperformance of quality and low beta stocks in a rapidly-rising market. This is clearly odd behavior and is very rare, restricted as far as I can tell to some, but not all, late-stage bull markets. I attribute the logic for this – and this effect is something I noticed almost 40 years ago when studying the Crash of 1929 [the Nifty Fifty, and the Tech Bubble of 2000].…
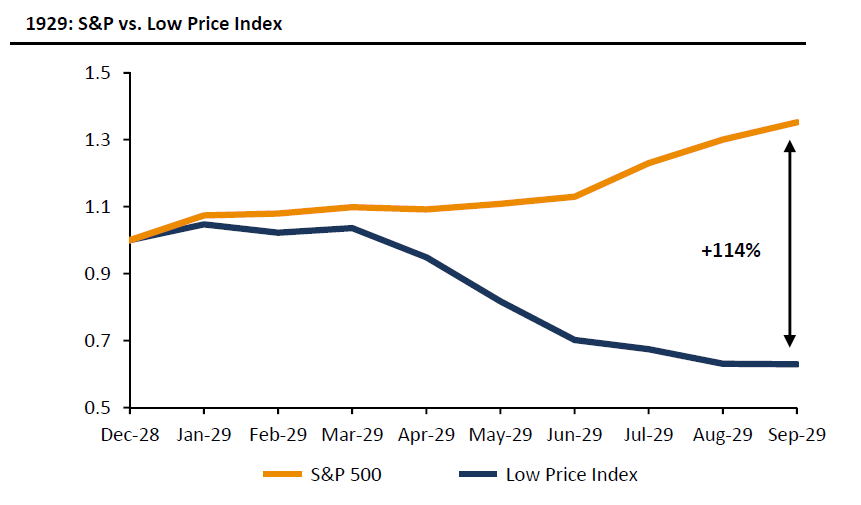
The 1929 Crash. A reasonable indicator of increasing concentration is the advance-decline line, and [the first chart below] makes it clear what was happening. But my favorite all-time data is shown in the second chart. This looks at the S&P’s “Low Price Index,” comprising very fallen industrial angels. This indicator, sadly abandoned in the late 90s, had a very high and very variable beta (about 1.4) and the index had just had a magnificent 1928, more than doubling the S&P 500 (+72% to +33%). Then, in 1929, it produced what I call the great primal scream of all-time from the market: By the time the S&P 500 peaked in October, up 35% for the year, accompanied by all the touchy-feely signs of crazy speculation, the Low Price Index was down 37%, having fallen steadily all year!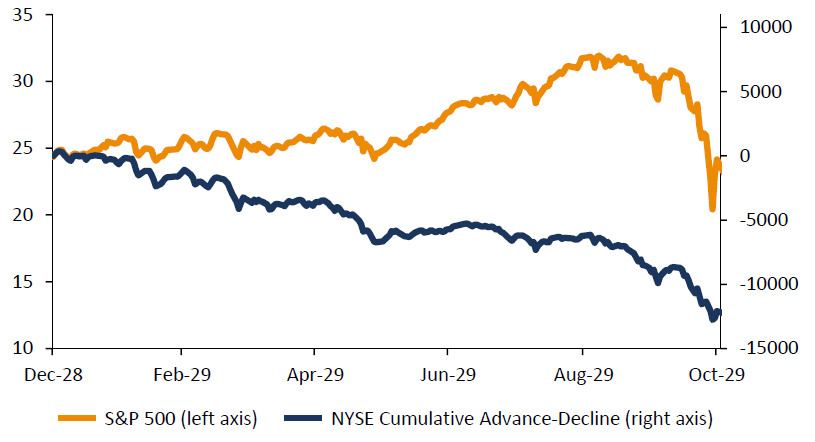 Source: S&P, Bloomberg, NYSE, Global Financial Data
 Source: S&P, FTSE, GMO
 Source: S&P, FTSE, GMO
 Source: S&P, Bloomberg, NYSE
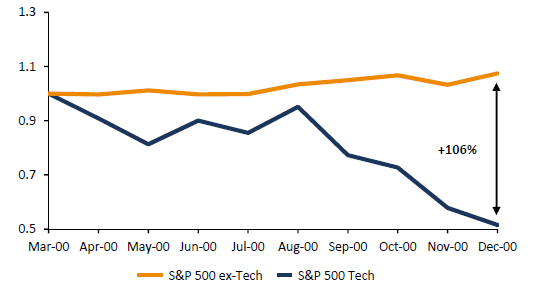 Source: S&P, FTSE, NYSE
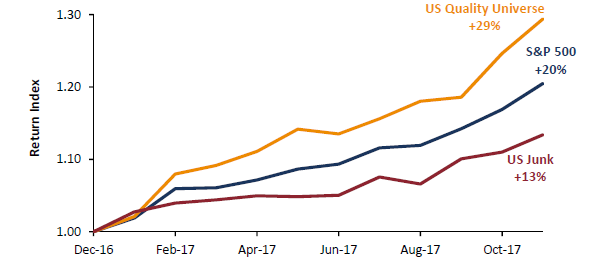 Source: S&P, Bloomberg, GMO
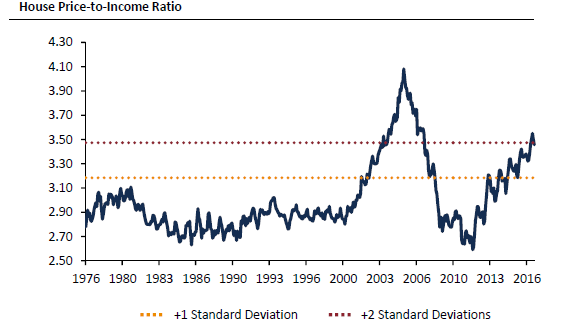 Source: National Association of Realtors, GMO
…
Extreme expensiveness At last, we come to value. Extreme overvaluation plays a huge role in bubbles breaking: It is a necessary precondition. The more overvalued, the merrier. But, for judging the extent that bubbles will overrun fair value and for timing the break, value, sadly, is largely irrelevant. Thus, it is a necessary but absolutely not sufficient condition. [The chart below] shows how handsomely the current cycle already passes the necessary condition.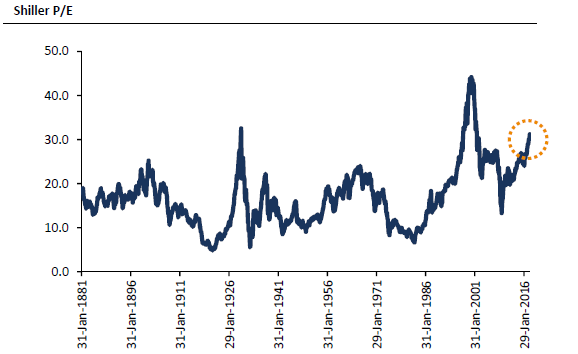 Source: Robert Shiller
…
The most difficult call: Are the more touchy-feely measures of market excess falling into place? Anyone around in 1999 and early 2000 has had a classic primer in these signs. We know we’re not there yet, but we can perhaps see some early movement: increasing vindictiveness to the bears for costing investors money; the crazy Bitcoins of the world (this is a true, crazy mini-bubble of its own I expect – it has certainly passed my “nephew test” of his obsessing about buying or not); and Amazon and the other handful of current heroes – here and globally – taking over more of the press coverage and a growing percentage of total market gains (Amazon +13%, the day before I started to write this, and Tencent doubling this year to a $500 billion market cap). The increasingly optimistic tone of press and TV coverage is also important. A mere six months ago, new market highs were hardly mentioned and learned bears were featured everywhere. Now, the newspaper and TV coverage is considerably more interested in market events. (This last comment reminds me of some advice for contrarians: There is usually a phase or two in each cycle where most investors expect a market gain or loss and it actually happens. The mass of investors usually ends up wrong in the end, but not all the time, for Heaven’s sake!) Other items worth mentioning are IPO windows and new record highs for corporate deals. We can have a satisfactory melt-up without them, but still one or the other is likely and both together are quite possible. I believe their presence would make a spectacular bust that much more likely. Finally, my favorite advice once again: Keep an eye on what the TVs at lunchtime eateries are showing. When most have talking heads yammering about Amazon, Tencent, and Bitcoin and not Patriot replays – just as late 1999 featured the latest in Pets.com – we are probably down to the last few months. Good luck. We’ll all need some.OUR CURRENT LIKES AND DISLIKES
Changes highlighted in bold.
LIKE
- Large-cap growth (during a correction)
- International developed markets (during a correction)
- Cash
- Publicly-traded pipeline partnerships (MLPs) yielding 7%-12% (buy less aggressively due to the recent sharp rally)
- Gold-mining stocks
- Gold
- Select blue chip oil stocks (wait for a pull-back after their recent strong run)
- Mexican stocks (at lower prices after this year’s robust rally)
- Bonds denominated in renminbi trading in Hong Kong (dim sum bonds)
- Short euro ETF (due to the euro’s weakness of late, refrain from initiating or adding to this short)
- Intermediate municipal bonds with strong credit ratings
- Investment-grade floating rate corporate bonds
NEUTRAL
- Most cyclical resource-based stocks
- Short-term investment grade corporate bonds
- High-quality preferred stocks yielding 6%
- Mid-cap growth
- Emerging stock markets, however a number of Asian developing markets, ex-India, appear undervalued
- Select European banks
- BB-rated corporate bonds (i.e., high-quality, high yield)
- Long-term Treasury bonds
- Long-term investment grade corporate bonds
- Intermediate-term Treasury bonds
- Long-term municipal bonds
- Emerging bond markets (dollar-based or hedged); local currency in a few select cases
- Solar Yield Cos (taking partial profits on these)
- Large-cap value
- Canadian REITs
- Intermediate-term investment-grade corporate bonds, yielding approximately 4%
DISLIKE
- US-based Real Estate Investment Trusts (REITs) (once again, some small-and mid-cap issues appear attractive; also, some retail-exposed REITs look deeply undervalued)
- Small-cap value
- Mid-cap value
- Small-cap growth
- Lower-rated junk bonds
- Canadian dollar-denominated bonds (the loonie is currently overbought)
- Short yen ETF (in fact, the yen looks poised to rally)
- Emerging market bonds (local currency)
- Emerging market bonds (local currency)
- Floating-rate bank debt (junk)
- US industrial machinery stocks (such as one that runs like a certain forest animal, and another famous for its yellow-colored equipment)
DISCLOSURE: This material has been prepared or is distributed solely for informational purposes only and is not a solicitation or an offer to buy any security or instrument or to participate in any trading strategy. Any opinions, recommendations, and assumptions included in this presentation are based upon current market conditions, reflect our judgment as of the date of this presentation, and are subject to change. Past performance is no guarantee of future results. All investments involve risk including the loss of principal. All material presented is compiled from sources believed to be reliable, but accuracy cannot be guaranteed and Evergreen makes no representation as to its accuracy or completeness. Securities highlighted or discussed in this communication are mentioned for illustrative purposes only and are not a recommendation for these securities. Evergreen actively manages client portfolios and securities discussed in this communication may or may not be held in such portfolios at any given time.